Chart USD/IDR Updates: Extending gains
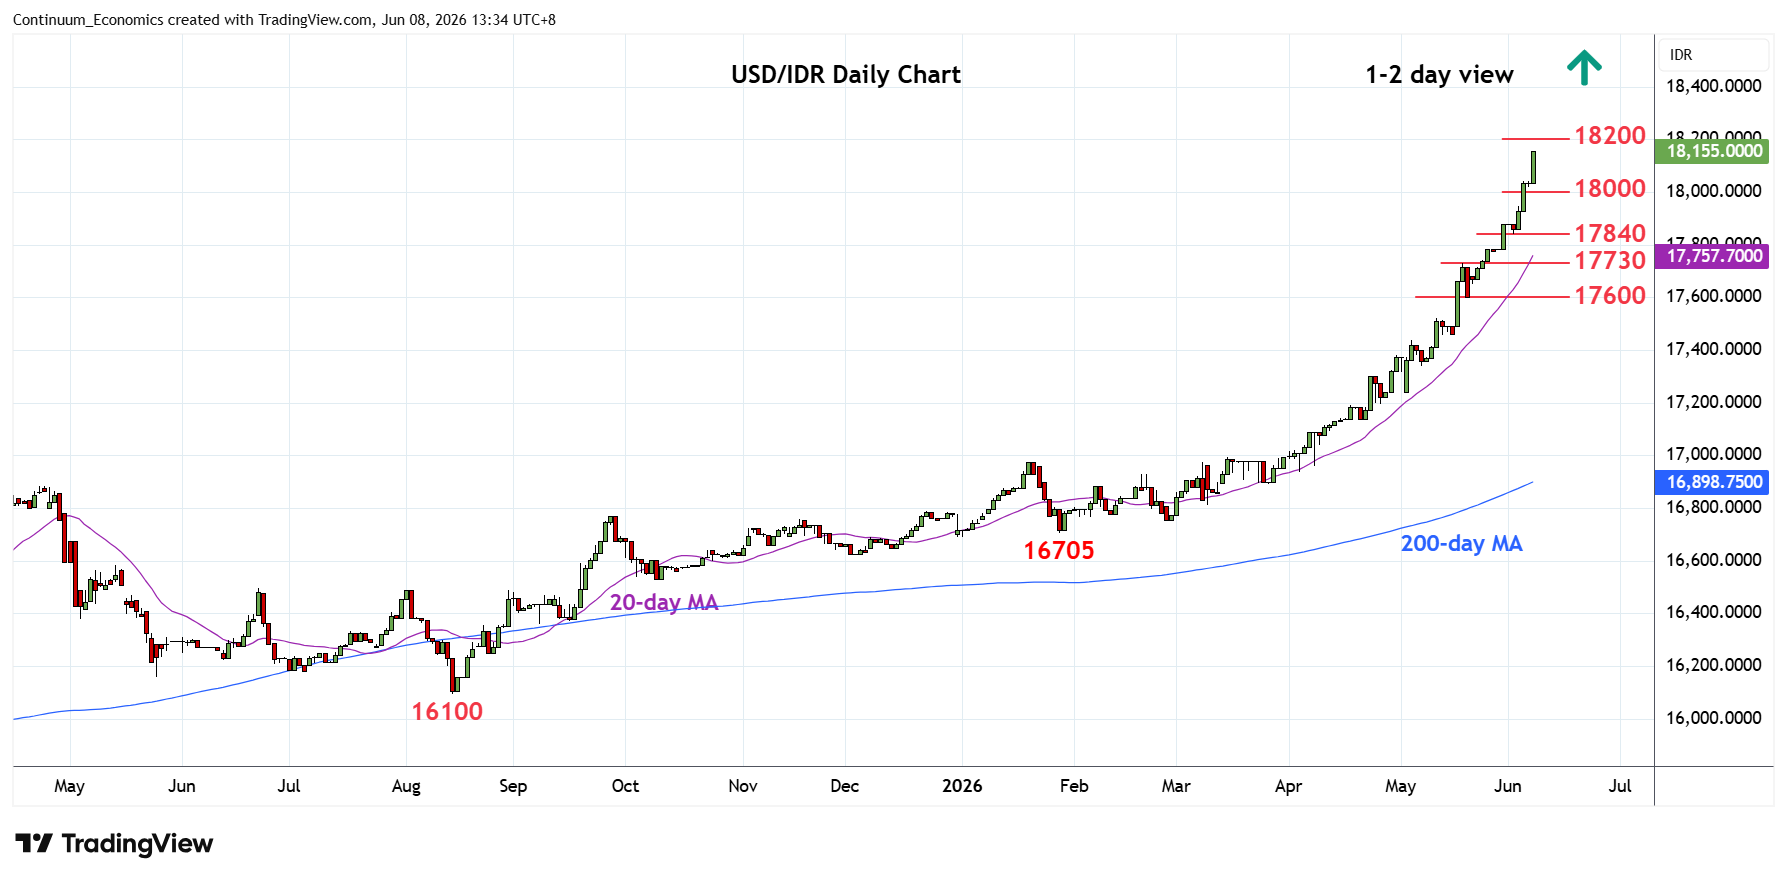
Break above the 18040 high of last week see prices extending parabolic gains from the 16705 January low to reach fresh historic high at 18155
| Levels | Imp | Comment | Levels | Imp | Comment | |||
|---|---|---|---|---|---|---|---|---|
| R4 | 19000 | projection | S1 | 18000 | * | figure | ||
| R3 | 18500 | projection | S2 | 17840 | * | 2 Jun low | ||
| R2 | 18200 | projection | S3 | 17730 | * | 19 May high | ||
| R1 | 18155 | intraday high | S4 | 17600 | * | congestion |
Asterisk denotes strength of level
05:40 GMT - Break above the 18040 high of last week see prices extending parabolic gains from the 16705 January low to reach fresh historic high at 18155. The upside stays firmly in focus and higher will see room to 18200 and 18500 projection targets. Overbought daily and weekly studies caution corrective pullback with support starting at the 18000 level. Would take pullback below this to see room for deeper correction to the 17840/17800 congestion area. Below here needed to ease the upside pressure and see room for pullback to retrace strong gains from the January low.