Published: 2026-09-18T03:08:01.000Z
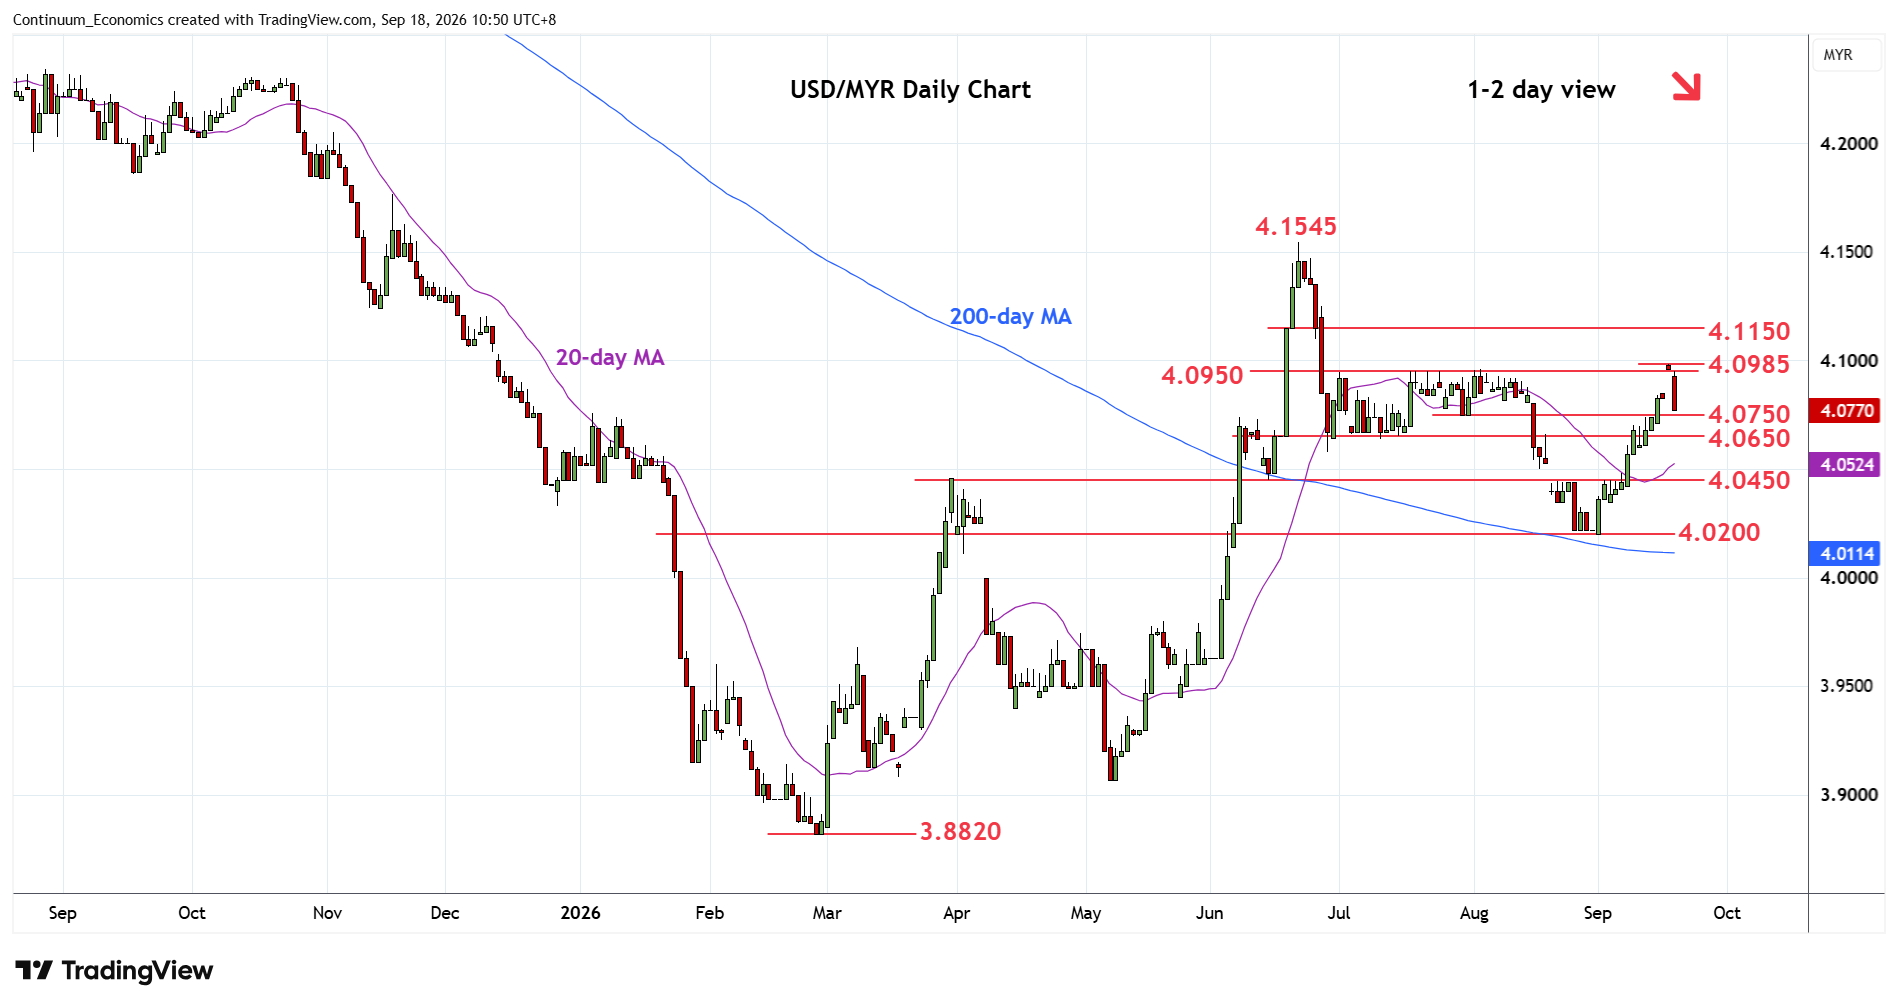
Chart USD/MYR Update: Sharp pullback from 4.0985 high
2
Sharp pullback from the 4.0985 high see prices reversing gains from the 4.0200 low to threaten the 4.0750 support
| Levels | Imp | Comment | Levels | Imp | Comment | |||
|---|---|---|---|---|---|---|---|---|
| R4 | 4.1350 | * | congestion | S1 | 4.0750 | * | 30 Jul low | |
| R3 | 4.1250 | * | 26 Jun high | S2 | 4.0650/600 | * | Jul low, congestion | |
| R2 | 4.1150 | * | congestion | S3 | 4.0450 | ** | 2 Sep high | |
| R1 | 4.0985 | ** | 17 Sep high | S4 | 4.0200 | ** | 1 Sep low, congestion |
Asterisk denotes strength of level
03:00 GMT - Sharp pullback from the 4.0985 high see prices reversing gains from the 4.0200 low to threaten the 4.0750 support. Daily studies are unwinding overbought readings and suggest scope for break here to open up room for deeper pullback to the 4.0650/4.0600 area. Below here will return focus to the downside to retrace gains from the 4.0200 low to 4.0450 support. Meanwhile, resistance at the 4.0950/4.0985 highs are expected to cap. Clearance, if seen, will see room for continuation to resistance at the 4.1150/4.1250 area.