Published: 2026-09-23T02:54:45.000Z
Chart USD/MYR Update: Extending losses
2
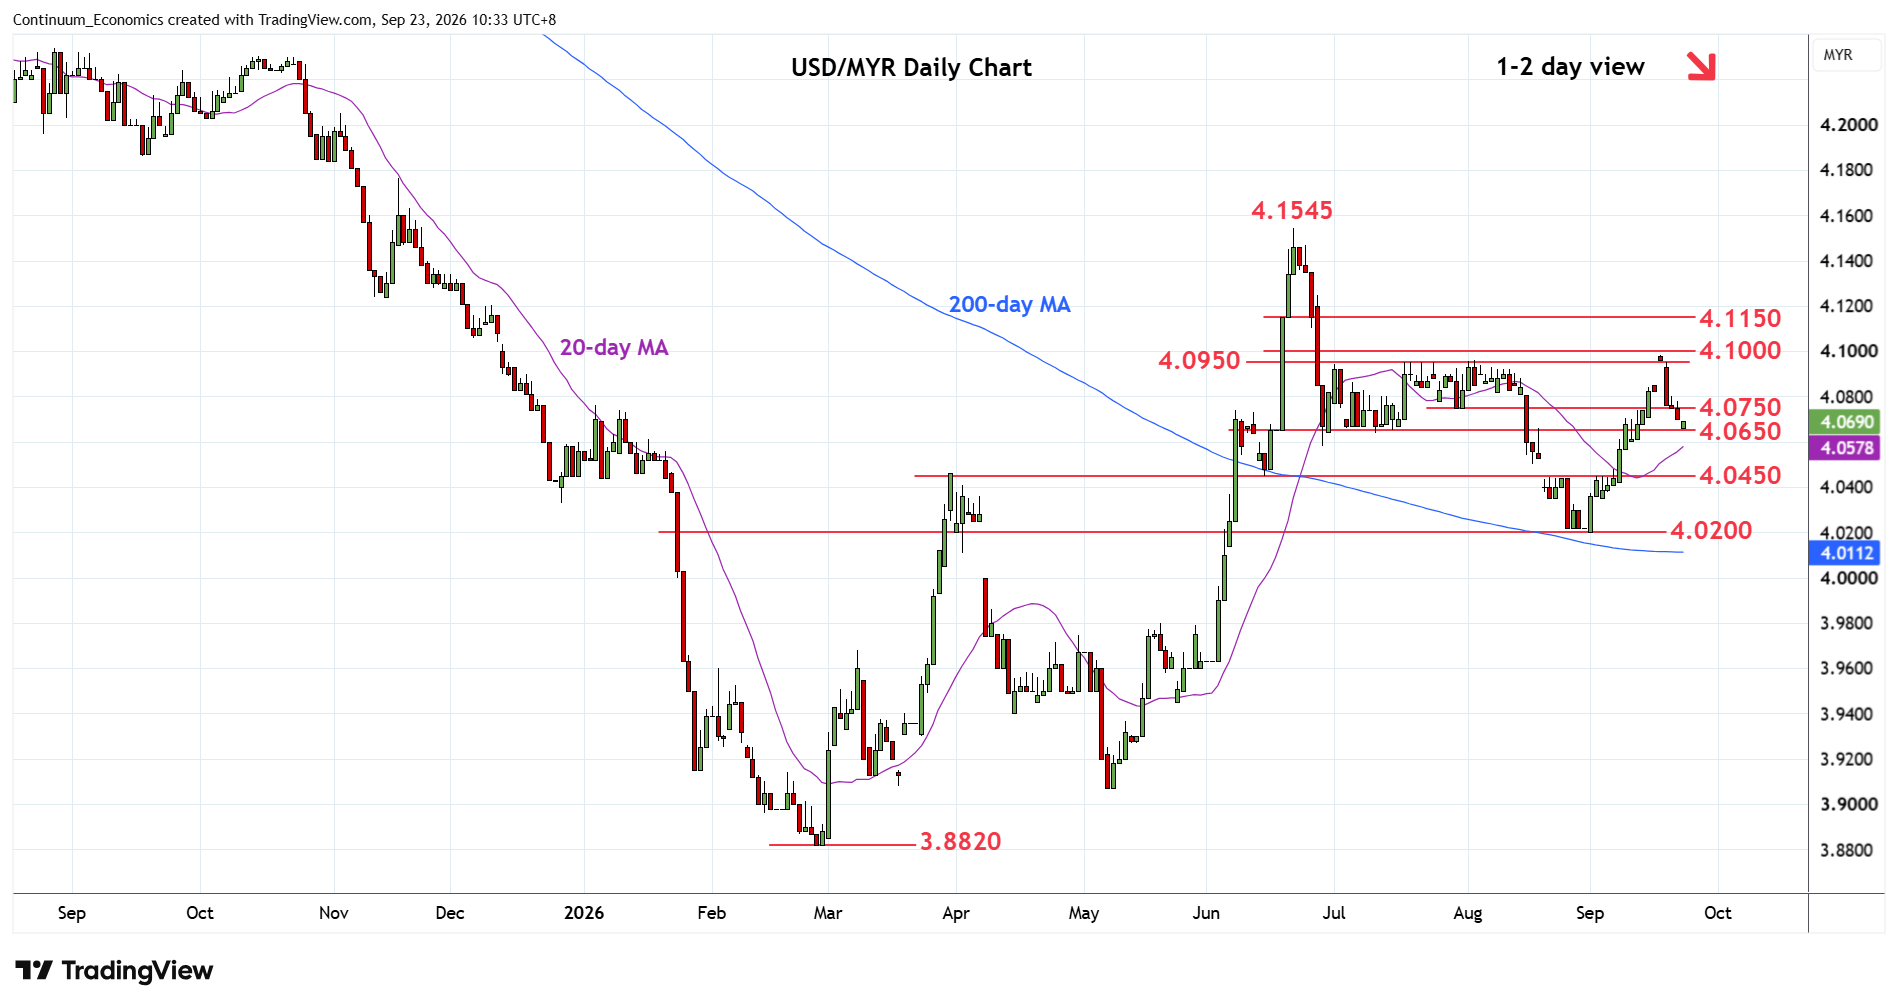
Prices remain under pressure with break of the 4.0750 support opening up extension to support at the 4.0650/4.0600 July low and congestion
| Levels | Imp | Comment | Levels | Imp | Comment | |||
|---|---|---|---|---|---|---|---|---|
| R4 | 4.1250 | * | 26 Jun high | S1 | 4.0650/600 | * | Jul low, congestion | |
| R3 | 4.1150 | * | congestion | S2 | 4.0450 | ** | 2 Sep high | |
| R2 | 4.0950/00 | ** | Jul, 17 Sep high | S3 | 4.0200 | ** | 1 Sep low, congestion | |
| R1 | 4.0800 | * | congestion | S4 | 4.0000 | * | figure |
Asterisk denotes strength of level
02:45 GMT - Prices remain under pressure with break of the 4.0750 support opening up extension to support at the 4.0650/4.0600 July low and congestion area. Negative daily studies keep pressure on the downside and break of the latter will see scope for deeper pullback to retrace strong gains from the 4.0200 low. Lower will see continuation to strong support at 4.0450 March high then 4.0200, 1 September low. Meanwhile, resistance is lowered to 4.0750/4.0800 area which is expected to cap corrective bounce and sustain losses from the 4.1000 high.