Published: 2026-06-30T03:03:45.000Z
Chart USD/THB Update: Leaning lower from 33.48 high
1
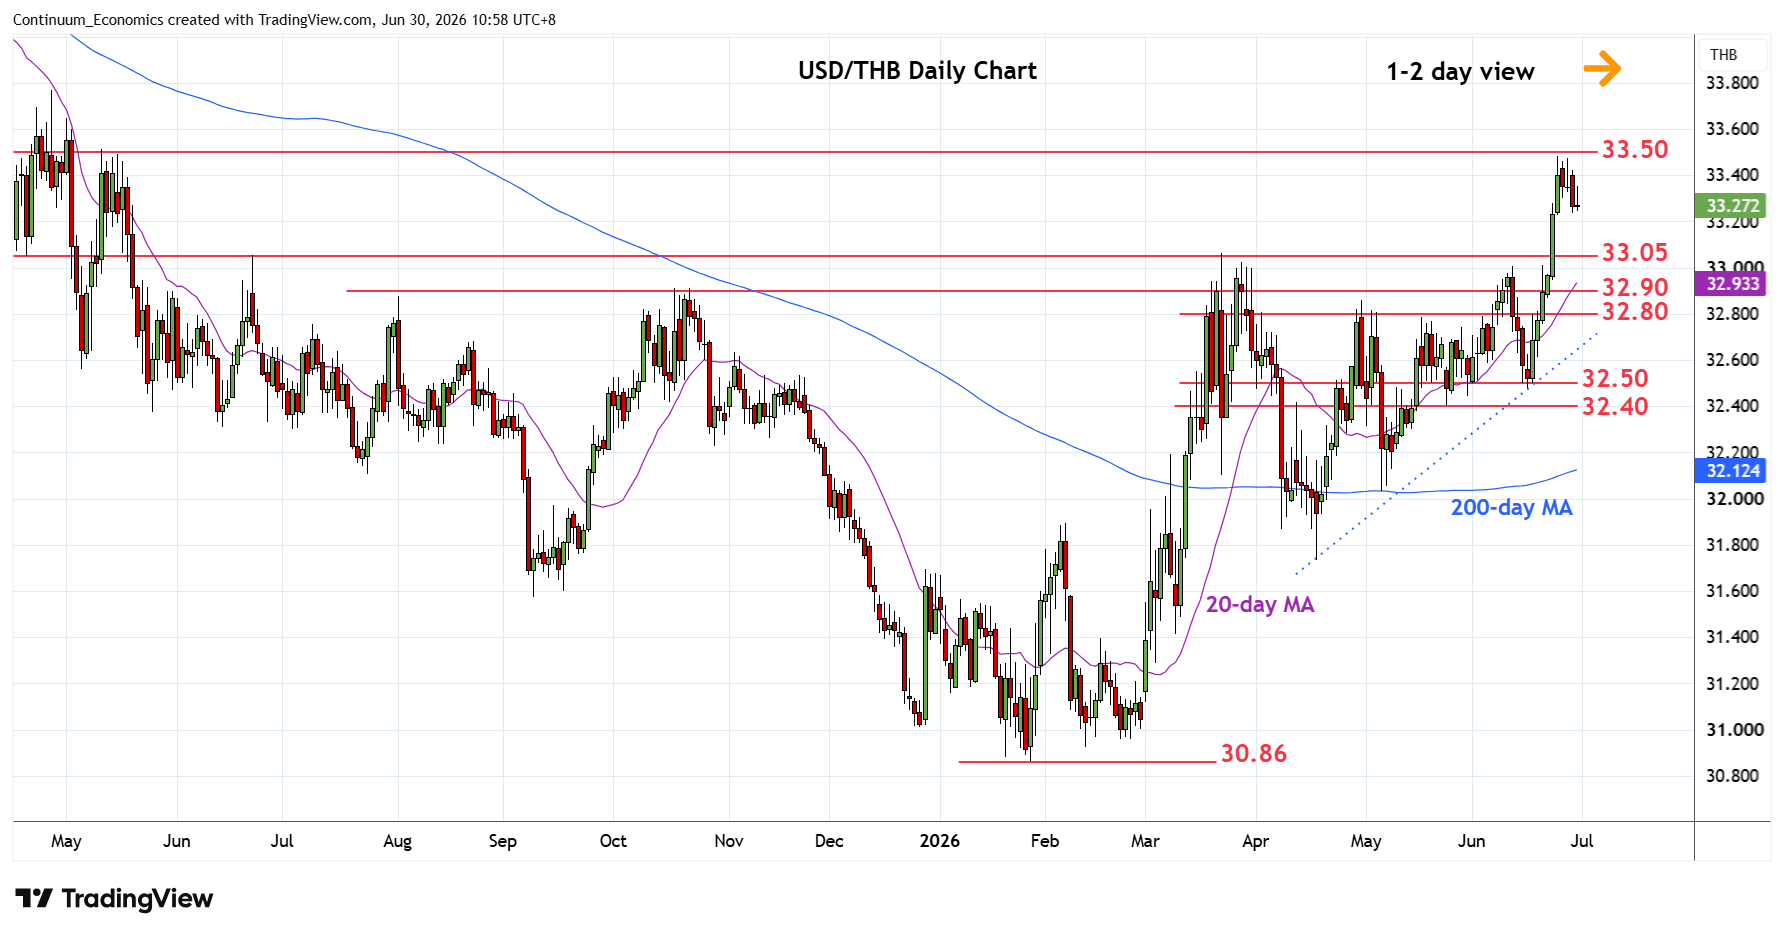
Leaning lower in range from the 33.48 current year high as prices consolidate strong gains from the 32.50 mid-June low
| Level | Comment | Level | Comment | |||||
|---|---|---|---|---|---|---|---|---|
| R4 | 34.00 | * | congestion, 76.4% | S1 | 33.20 | congestion | ||
| R3 | 33.77 | 28 Apr high | S2 | 33.05 | ** | Mar high | ||
| R2 | 33.50 | * | congestion | S3 | 32.90 | * | Oct high | |
| R1 | 33.48 | ** | 24 Jun YTD high | S4 | 32.80 | * | congestion |
Asterisk denotes strength of level
03:00 GMT - Leaning lower in range from the 33.48 current year high as prices consolidate strong gains from the 32.50 mid-June low. Stretched daily and weekly studies caution pullback with support starting 33.20 congestion then the 33.05 March high which should underpin. Would take break of these to fade the upside pressure and see room for deeper pullback to retrace strong gains from 31.74, April swing low. Lower will see room to support at the 32.90/32.80 congestion area. Meanwhile, resistance at the 33.48/33.50 high and congestion area expected to cap.