Published: 2026-07-03T03:29:56.000Z
Chart USD/MYR Update: Under pressure
-
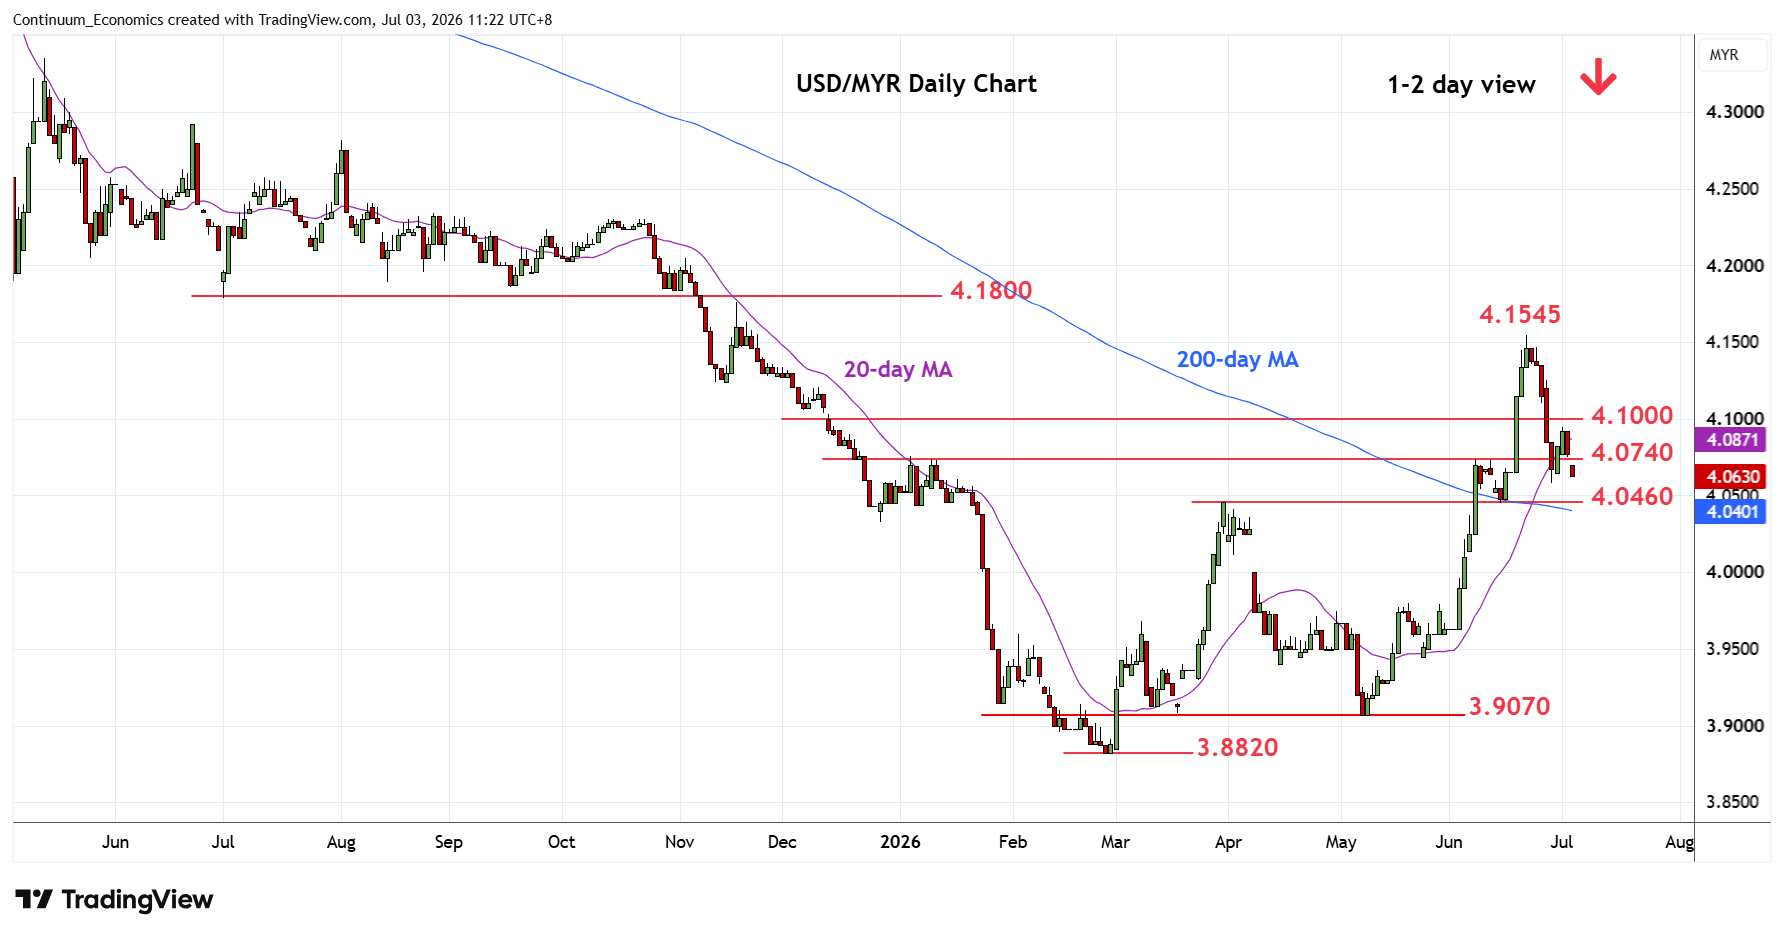
Under pressure, as consolidation above the 4.0580 support gives way to fresh selling pressure
| Levels | Imp | Comment | Levels | Imp | Comment | |||
|---|---|---|---|---|---|---|---|---|
| R4 | 4.2000 | ** | 50% 2025/2026 fall | S1 | 4.0460 | ** | Mar high | |
| R3 | 4.1800 | ** | 2025 year low | S2 | 4.0000 | * | figure, congestion | |
| R2 | 4.1545 | ** | 22 Jun YTD high | S3 | 3.9800 | ** | May high | |
| R1 | 4.1000 | * | congestion | S4 | 3.9500 | * | congestion |
Asterisk denotes strength of level
03:30 GMT - Under pressure, as consolidation above the 4.0580 support gives way to fresh selling pressure. Break here will extend sharp pullback from the 4.1545 current year high of 22 June and see room to strong support at 4.0460. Daily and weekly studies have turned down to unwind overbought readings and threatens break here to retrace gains from the 3.8820 February YTD low. Lower will see extension to 4.0000 figure and lower. Meanwhile, resistance is lowered to the 4.0945/4.1000, high of 1 July and congestion area.