Published: 2026-11-20T03:00:04.000Z
Chart USD/CNH Update: Breakout from the March wedge pattern
1
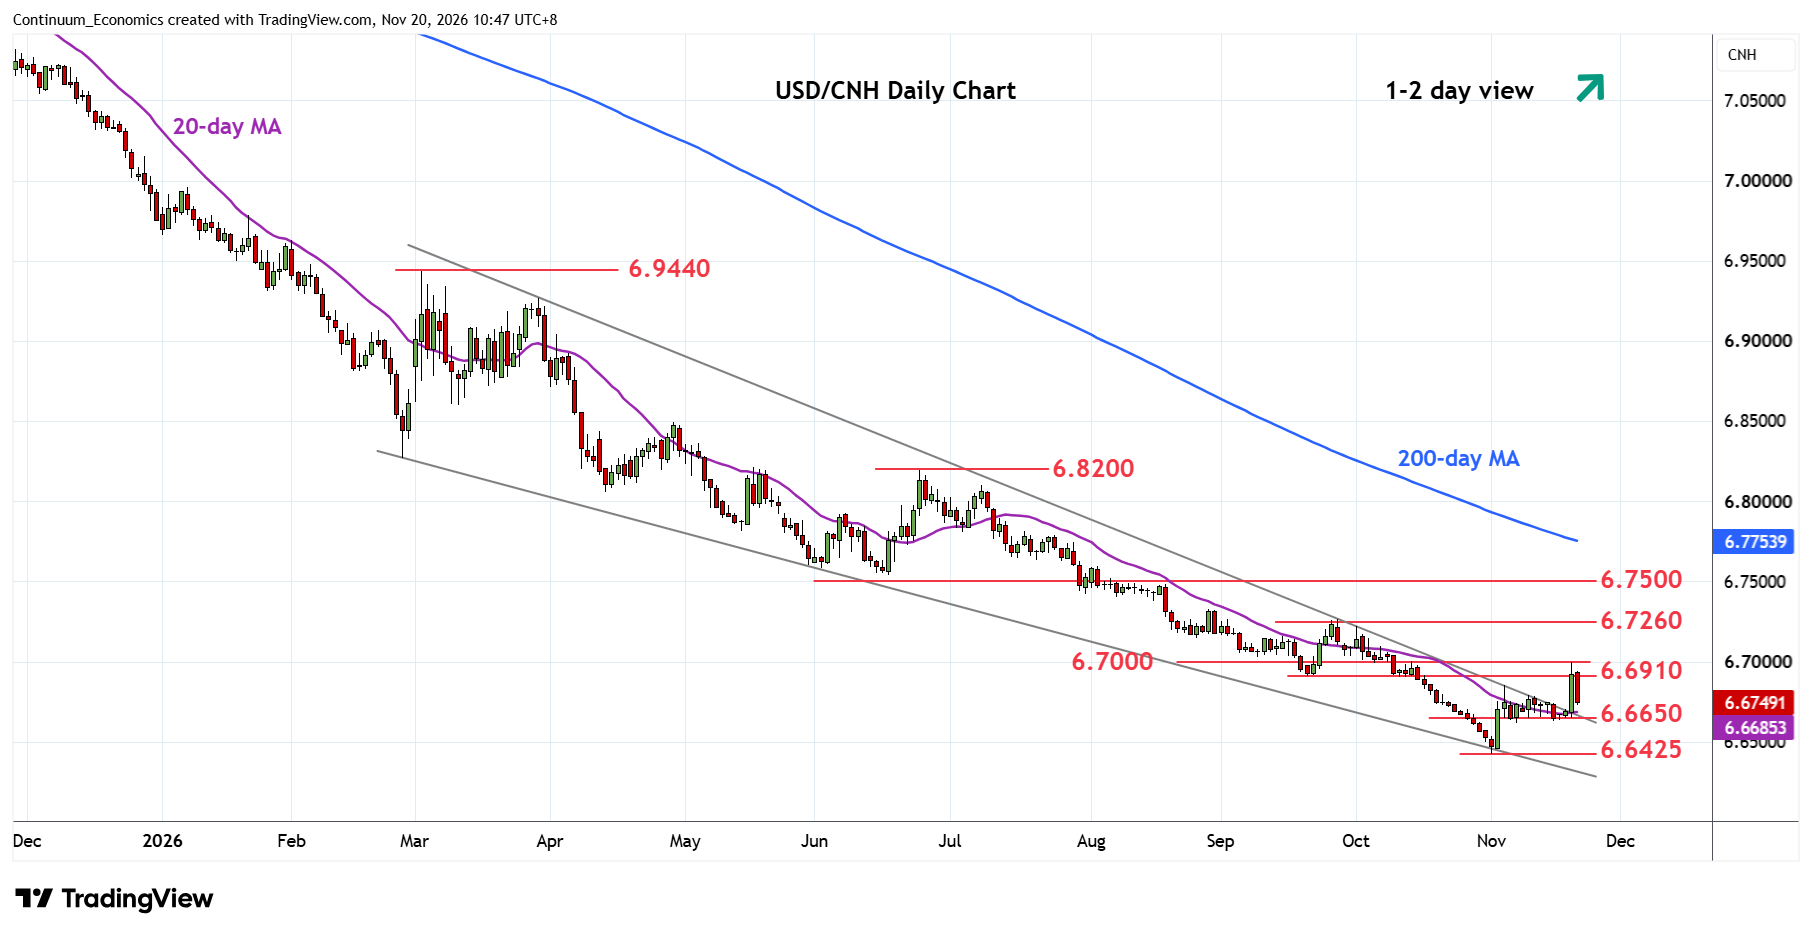
Consolidation above the 6.6650/00 support finally gave way to break of the wedge pattern from the March high
| Level | Imp | Comment | Level | Imp | Comment | |||
|---|---|---|---|---|---|---|---|---|
| R4 | 6.7500 | ** | congestion | S1 | 6.6650 | * | congestion | |
| R3 | 6.7330 | * | 28 Aug high | S2 | 6.6425 | ** | 2 Nov YTD low | |
| R2 | 6.7260 | ** | Sep high | S3 | 6.6160 | * | Jun 2022 low | |
| R1 | 6.7000 | * | figure, congestion | S4 | 6.6000 | ** | figure |
Asterisk denotes strength of level
02:50 GMT - Consolidation above the 6.6650/00 support finally gave way to break of the wedge pattern from the March high. Gains reach the 6.7000 figure but has since settled back towards the 6.6650 support. Consolidation here is expected to give way to renewed buying interest later. Above the 6.7000 figure, will see room to 6.7260, September swing high. Higher still, will open up scope to strong resistance at 6.7500/6.7540 area. Meanwhile, support remains at the 6.6650/00 congestion area. Break here will expose the 6.6425 current year low to retest.