Published: 2026-08-25T07:10:53.000Z
Chart USD/TWD Update: Consolidating, but still heavy
1
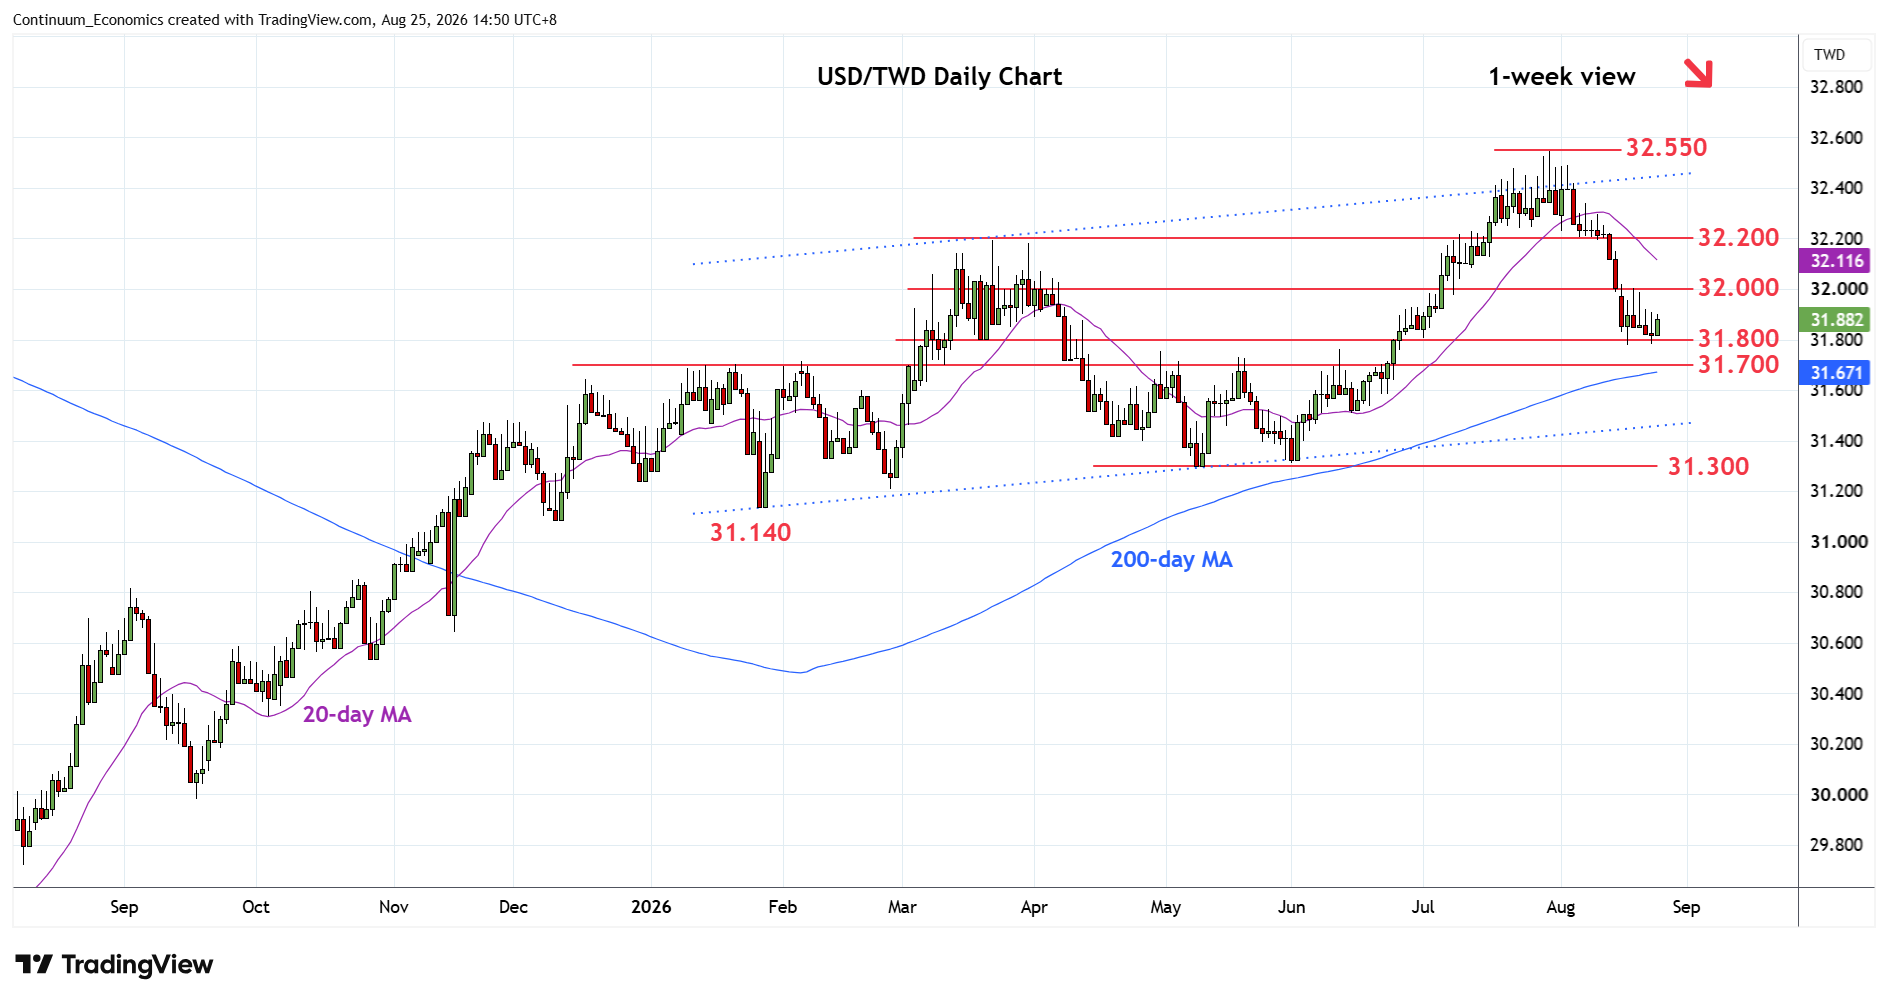
Steadied at the 31.800 congestive support as prices consolidate losses from the 32.550 high
| Levels | Imp | Comment | Levels | Imp | Comment | |||
|---|---|---|---|---|---|---|---|---|
| R4 | 32.550 | ** | 30 Jul YTD high | S1 | 31.800 | * | congestion | |
| R3 | 32.400 | * | congestion | S2 | 31.700 | ** | Jan, Feb highs | |
| R2 | 32.200 | ** | Mar high, congestion | S3 | 31.600 | * | congestion | |
| R1 | 32.000 | * | congestion | S4 | 31.500 | * | congestion |
07:00 GMT - Steadied at the 31.800 congestive support as prices consolidate losses from the 32.550 high. Daily studies have turned up from oversold areas but bounce likely to prove limited and the 32.000 level expected to cap and give way to renewed selling pressure later. Below 31.800 will expose strong support at 31.700, January/February highs. Below here will open up room for deeper pullback to retrace gains from the January low towards 31.600/31.500 congestion area. Meanwhile, break above the 32.000 level, if seen, will ease the downside pressure and see room for stronger bounce to 32.200, March high.