Weekly Chart GBP/USD Update: Consolidating recent gains - background studies continue to rise
Cautious/choppy trade around 1.3550 has given way to the anticipated break higher
Cautious/choppy trade around 1.3550 has given way to the anticipated break higher,
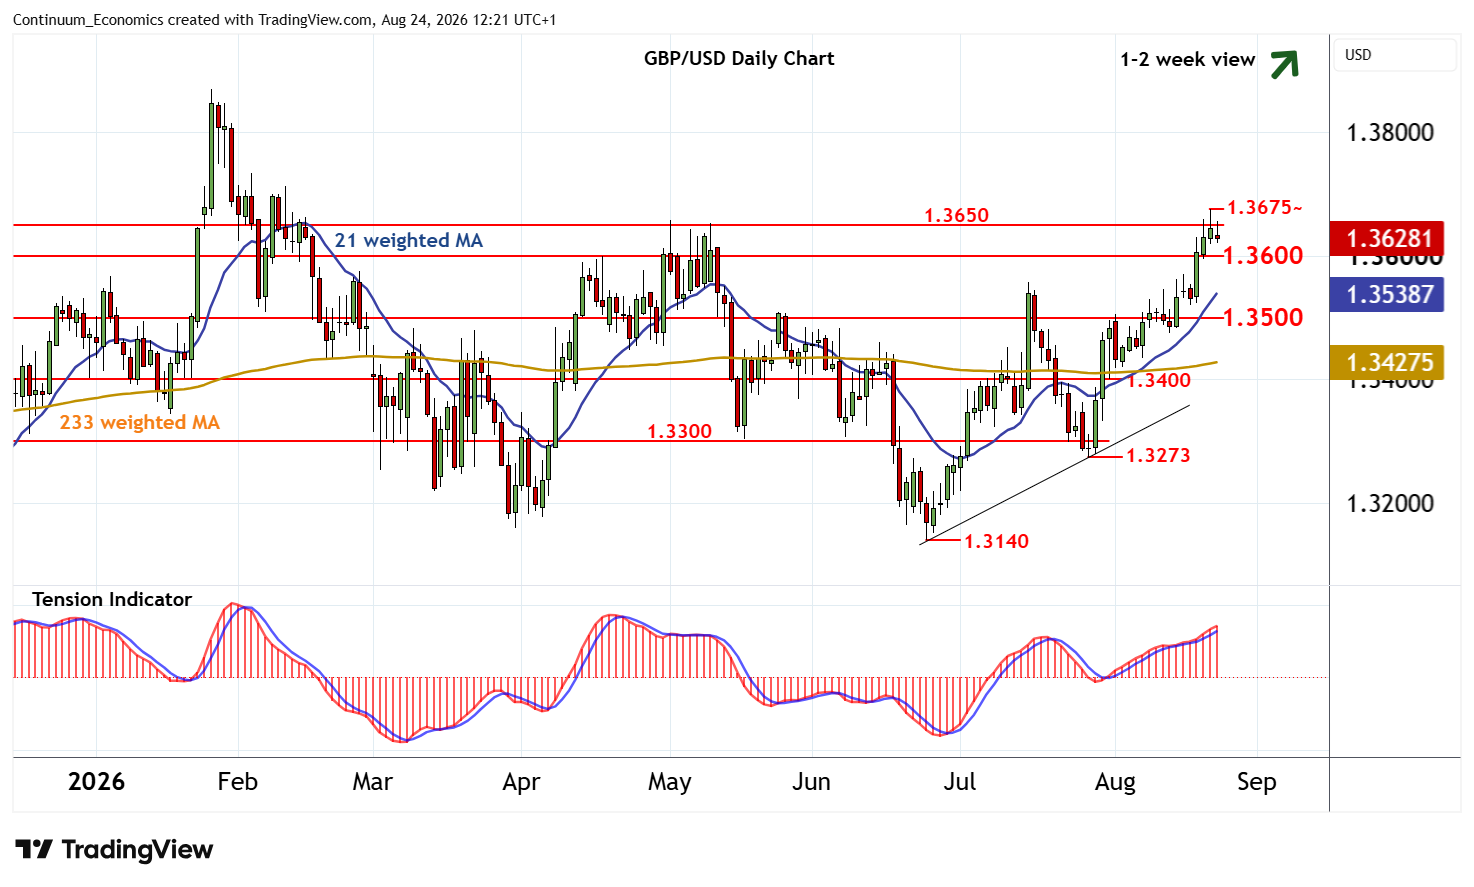
The test above resistance at the 1.3650 break level has reached 1.3675, before settling lower into consolidation above 1.3600.
Flat overbought daily stochastics are turning down, suggesting room for a test of 1.3600. But the positive daily Tension Indicator should limit any deeper losses in renewed buying interest/consolidation above further congestion around 1.3500.
A close beneath here, however, will add weight to sentiment and extend losses from the 1.3675~ weekly high of 21 August towards further congestion around 1.3400.
Following corrective/cautious trade, positive weekly charts highlight room for fresh gains.
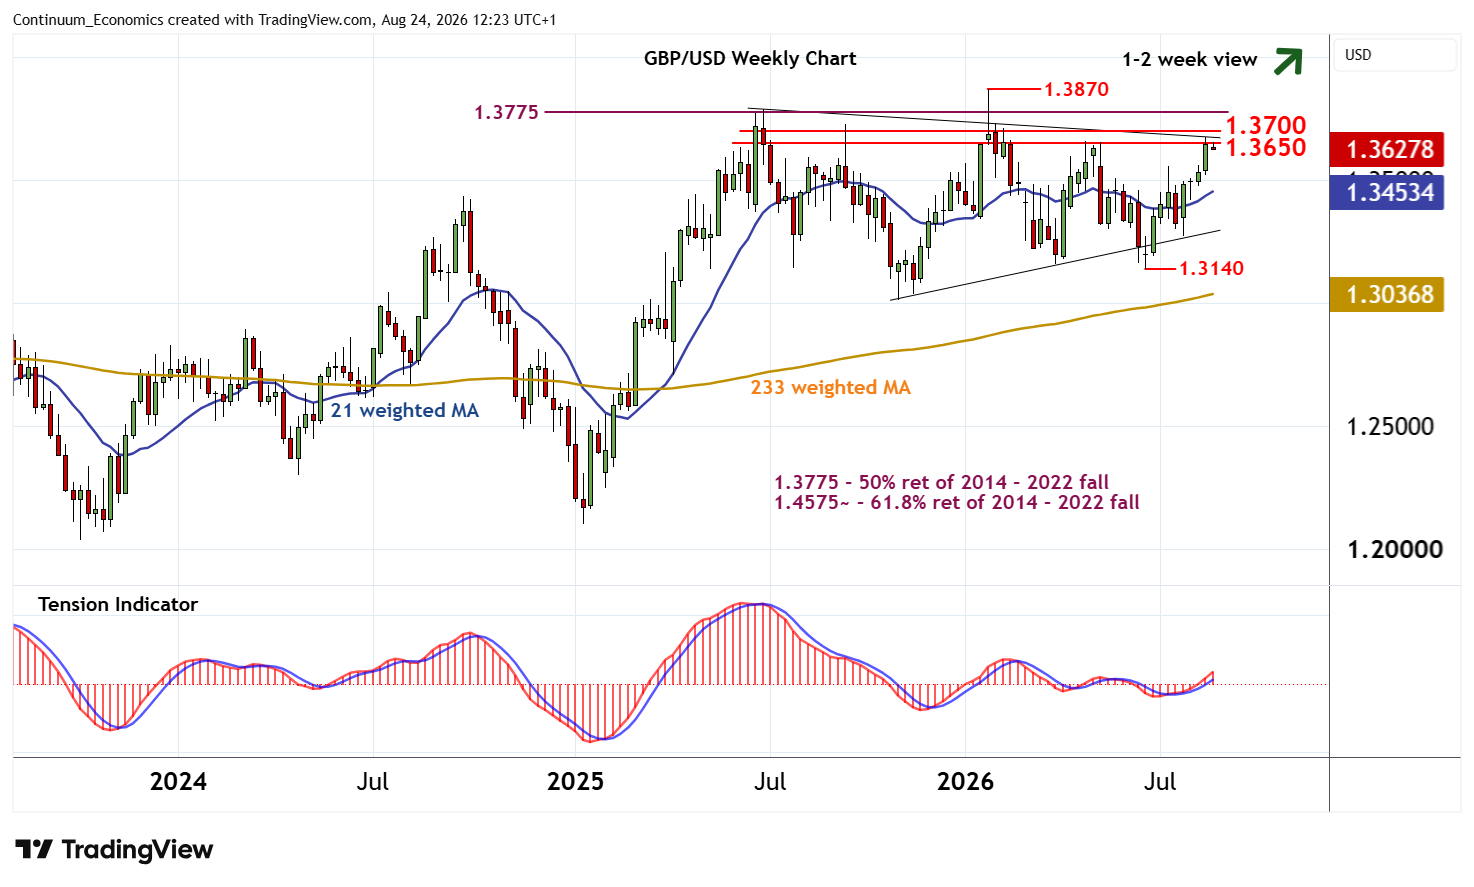
A close above 1.3650 will improve sentiment, likely confirm completion of the multi-month triangle and confirm continuation of gains from the 1.3140 monthly low of 24 June towards further congestion around 1.3700. Beyond here is the 1.3775 multi-year Fibonacci retracement. But already overbought weekly stochastics and mixed longer-term charts could limit any initial tests of here in renewed profit-taking/consolidation.
(A close above the 1.3870 multi-year high of 27 January would confirm continuation of gains from the 1.0360 year low of September 2022.)