Published: 2026-10-15T00:27:08.000Z
Chart AUD/USD Update: Back within .6950/.7000 range
1
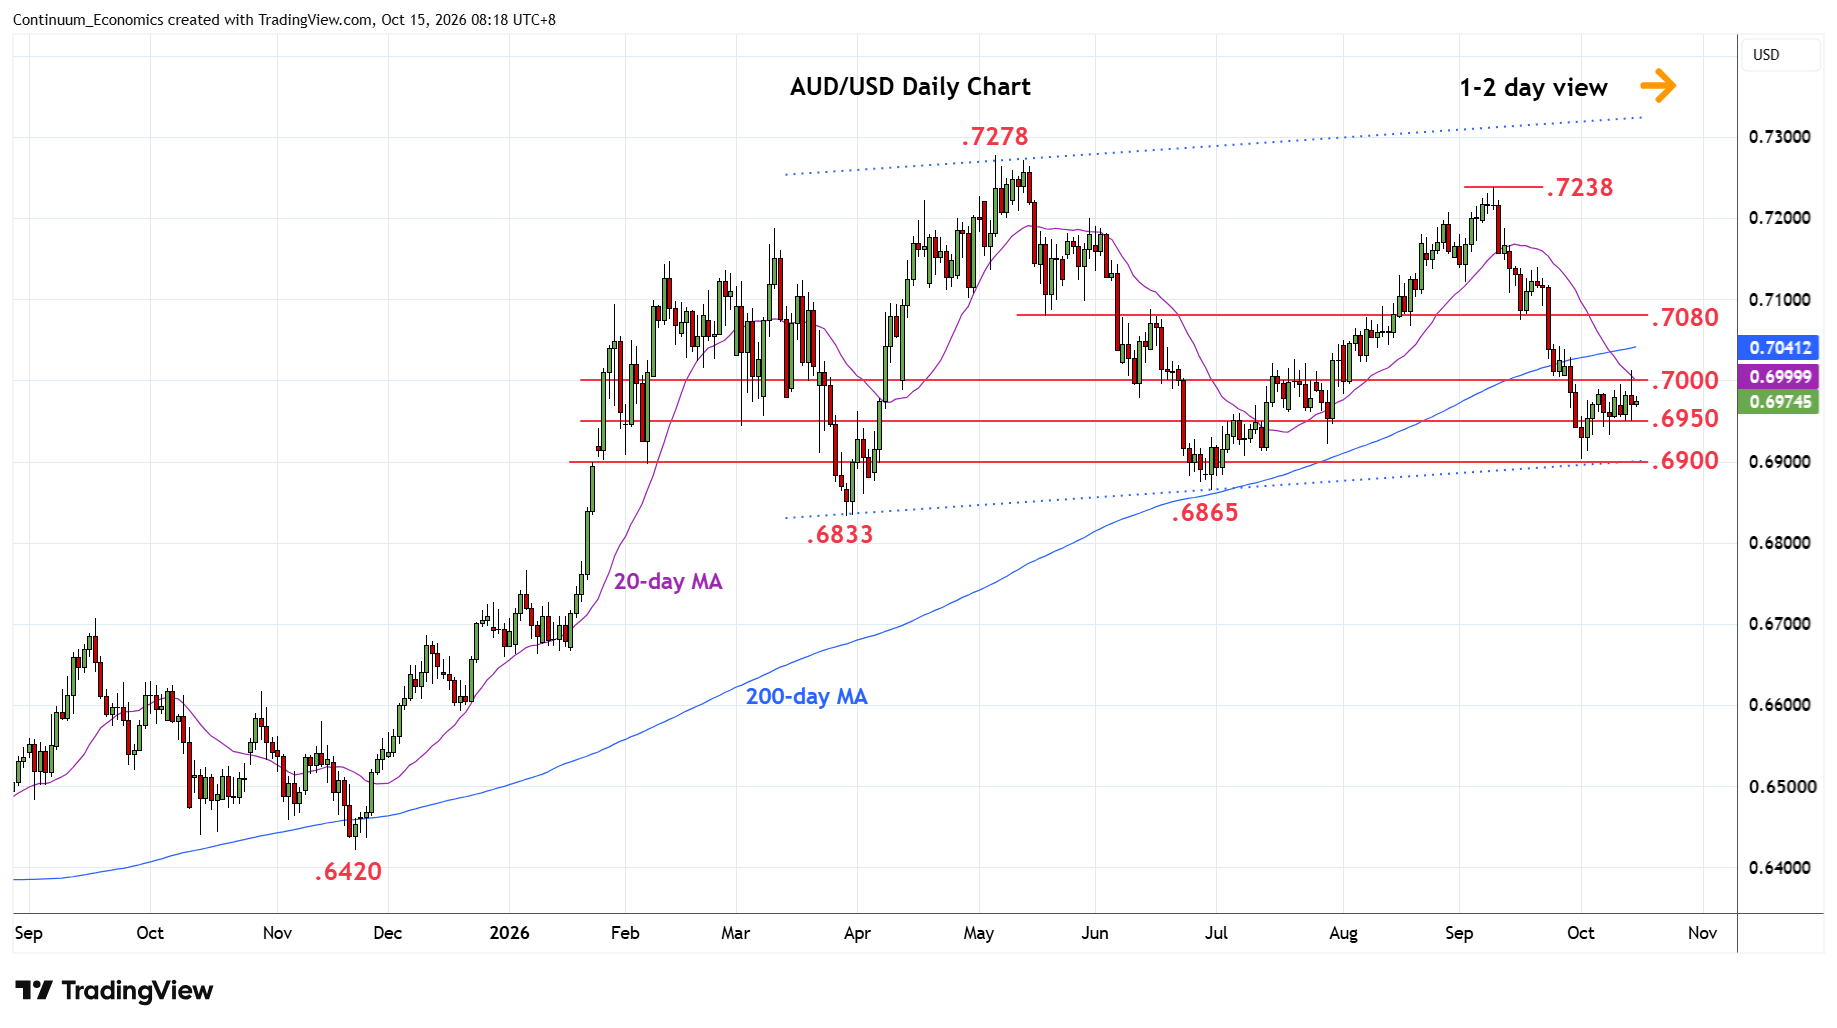
Settled back to the .6950/.7000 range area after bounce attempt was rejected at the .7013 high
| Levels | Imp | Comment | Levels | Imp | Comment | |||
|---|---|---|---|---|---|---|---|---|
| R4 | 0.7100 | ** | congestion | S1 | 0.6950 | * | congestion | |
| R3 | 0.7080 | * | May low | S2 | 0.6900 | ** | congestion, channel | |
| R2 | 0.7050 | * | congestion | S3 | 0.6865 | ** | Jun low | |
| R1 | 0.7000 | * | congestion | S4 | 0.6833 | ** | Mar low |
Asterisk denotes strength of level
00:20 GMT - Settled back to the .6950/.7000 range area after bounce attempt was rejected at the .7013 high. Further ranging action can be expected with closed above .7000 congestion needed to open up room for stronger gains to retrace losses from the September high. Clearance, if seen, will open up room towards the .7050 congestion then the strong resistance at the .7080/.7100, May low congestion area. Meanwhile, break of the .6950 support will open up room for retest of the .6900 level and channel support. Break here will extend the September losses to retest the critical .6865/.6833, June and March lows.