Chart USD Index DXY Update: Cautious trade
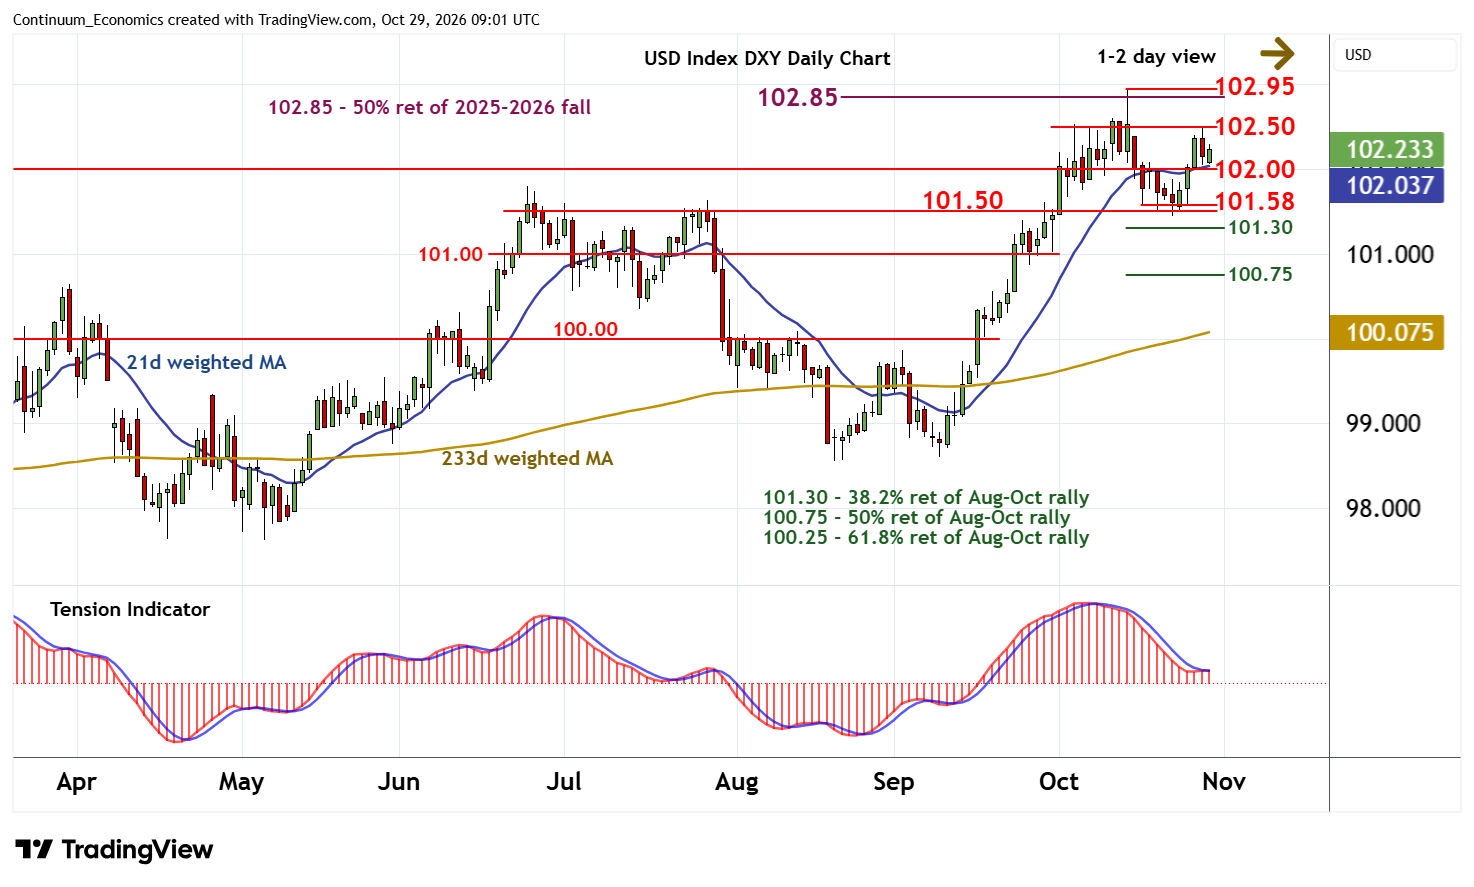
Little change, as the pullback from congestion resistance at 102.50 gives way to consolidation around 102.20
| Levels | Imp | Comment | Levels | Imp | Comment | |||
|---|---|---|---|---|---|---|---|---|
| R4 | 103.50 | ** | congestion | S1 | 102.00 | ** | congestion | |
| R3 | 102.95/00 | ** | 14 Oct YTD high; congestion | S2 | 101.50/58 | * | range highs; 16 Oct (w) low | |
| R2 | 102.85 | ** | 50% ret of 2025-2026 fall | S3 | 101.30 | * | 38.2% ret of Aug-Oct rally | |
| R1 | 102.50 | congestion | S4 | 101.00 | ** | congestion |
Asterisk denotes strength of level
08:40 GMT - Little change, as the pullback from congestion resistance at 102.50 gives way to consolidation around 102.20. Rising daily readings are showing signs of flattening, suggesting a more cautious tone into the coming sessions, and consolidation within the 102.00 - 102.50 range. A break above 102.50 would help to improve sentiment and open up a test of critical resistance at the 102.85 Fibonacci retracement and the 102.95 current year high of 14 October. But mixed weekly charts could limit any initial tests in fresh consolidation, before bullish longer-term charts prompt a break and confirm continuation of January gains.
Meanwhile, a close below congestion support at 102.00 should give way to range extension above strong support within the 101.50 range highs and the 101.58 weekly low of 16 October.