Published: 2026-06-19T13:31:15.000Z
Chart AUD/USD Update: Pressuring support - studies falling
-
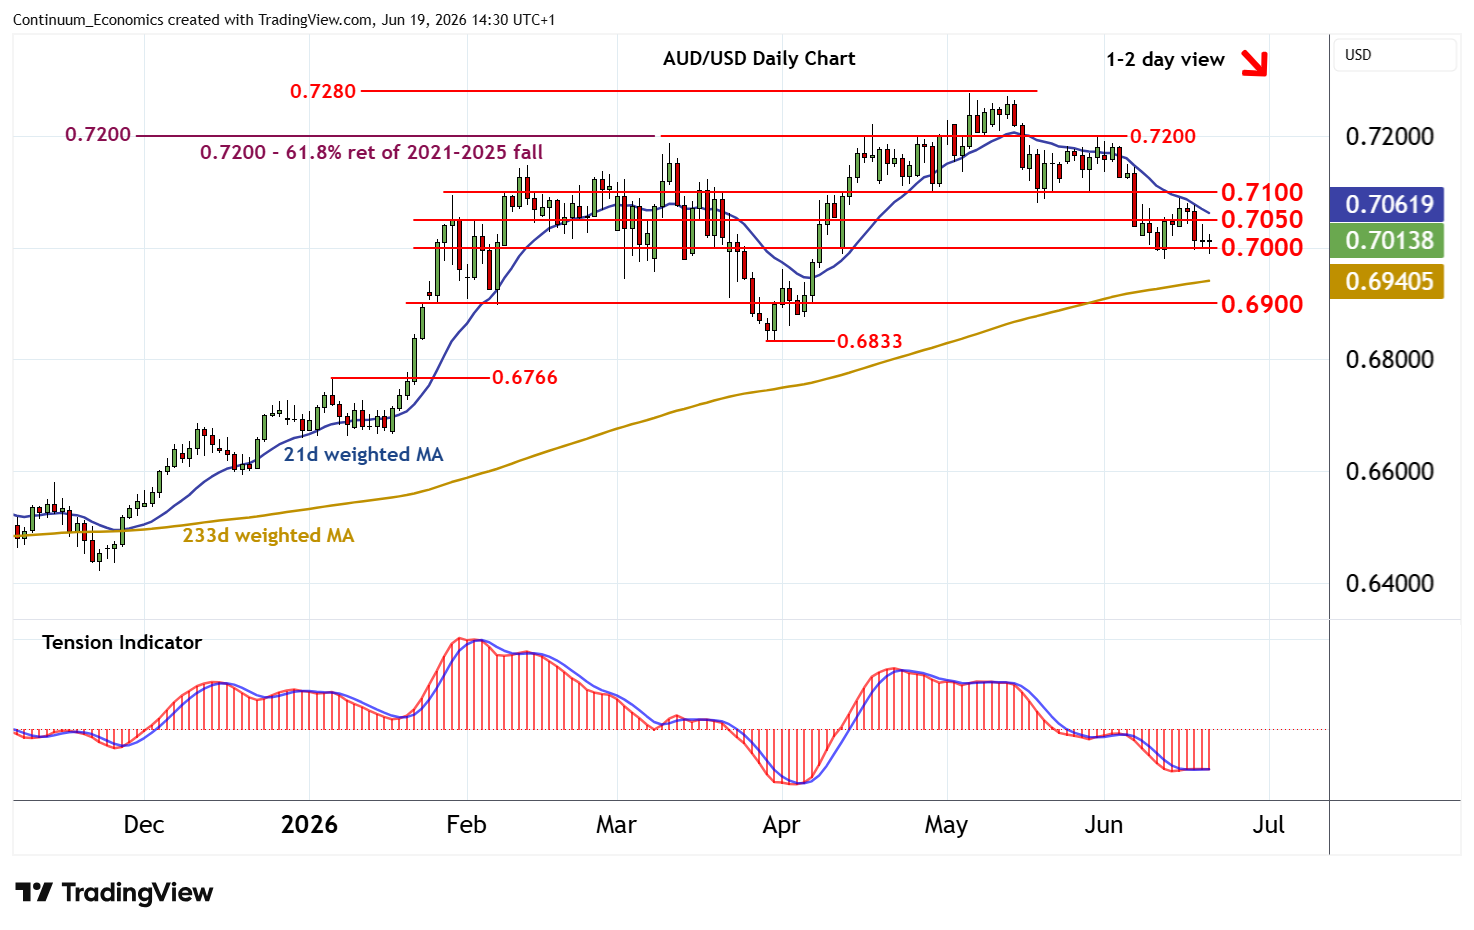
Little change, as unwinding oversold intraday studies extend consolidation around congestion support at 0.7000
| Levels | Imp | Comment | Levels | Imp | Comment | |||
|---|---|---|---|---|---|---|---|---|
| R4 | 0.7280 | ** | June 2022 (m) high | S1 | 0.7000 | * | congestion | |
| R3 | 0.7200 | ** | break level, 61.8% ret | S2 | 0.6900 | * | congestion | |
| R2 | 0.7100 | congestion | S3 | 0.6833 | ** | 30 Mar (m) low | ||
| R1 | 0.7050 | * | congestion | S4 | 0.6766 | ** | 7 Jan (w) high |
Asterisk denotes strength of level
14:25 BST - Little change, as unwinding oversold intraday studies extend consolidation around congestion support at 0.7000. Daily readings are under pressure and broader weekly charts are negative, highlighting room for further losses in the coming sessions. A close below 0.7000 will turn sentiment negative and extend early-May losses towards further congestion around 0.6900. Meanwhile, a close back above congestion resistance at 0.7050 will help to stabilise price action and give way to consolidation beneath further congestion around 0.7100.