Published: 2026-11-16T07:15:57.000Z
Chart USD/CAD Update: Extending gains
1
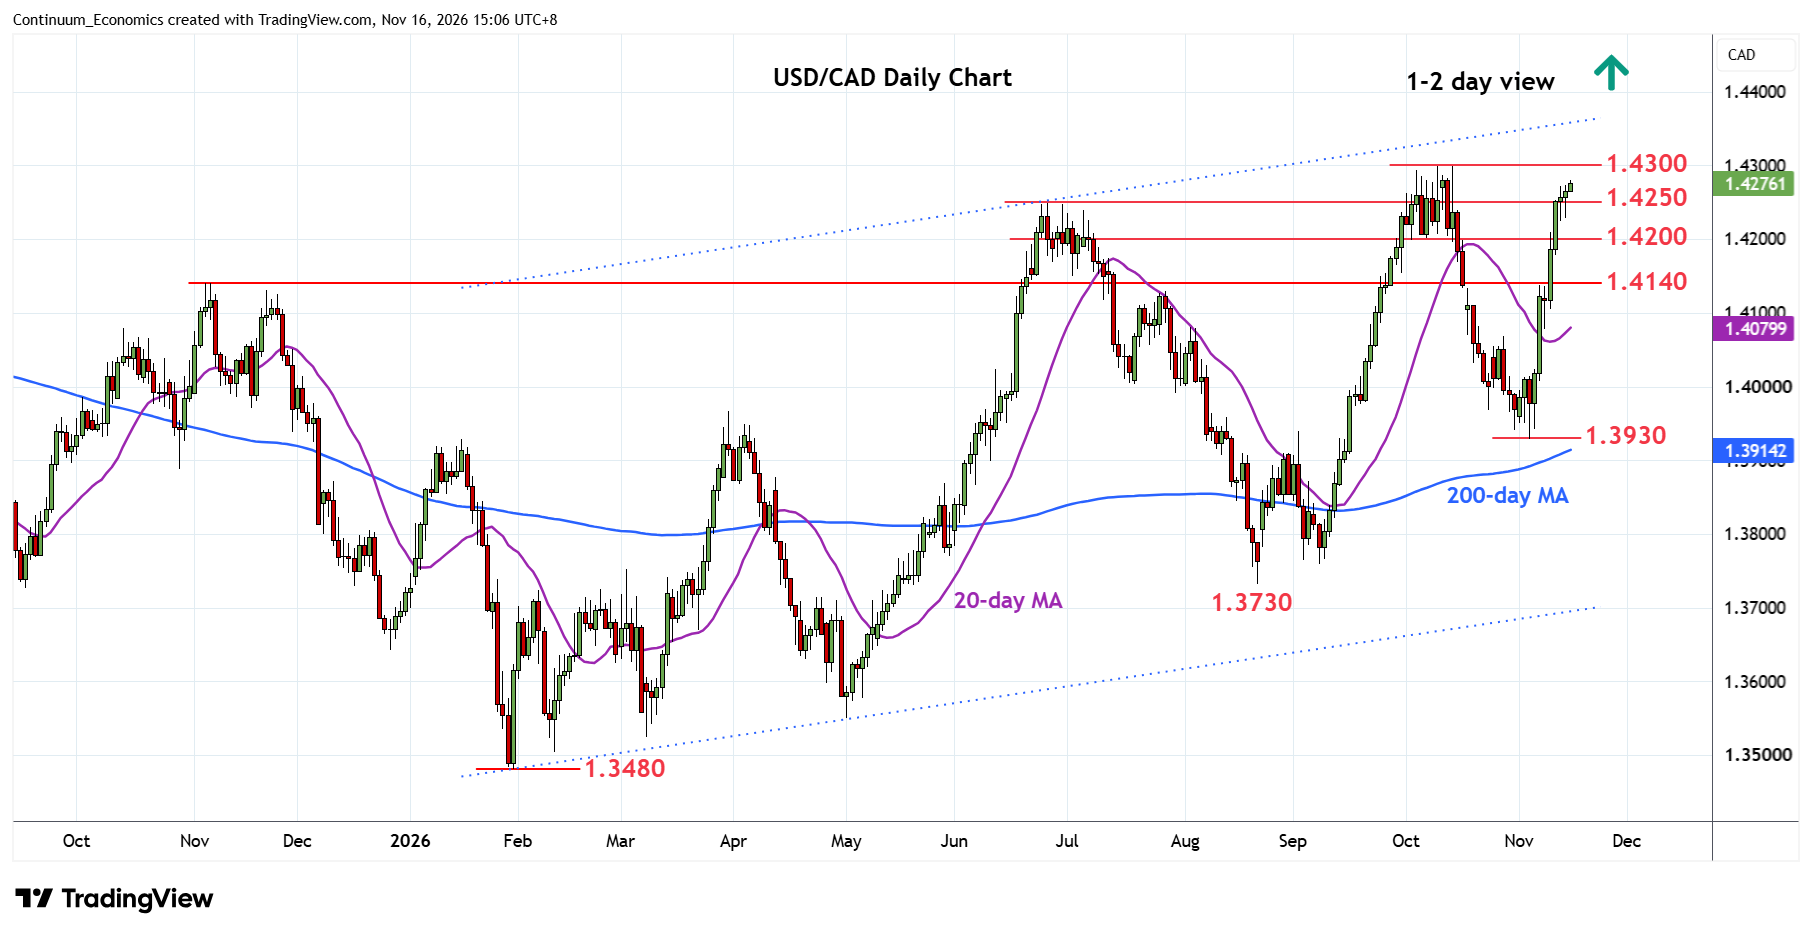
Break above the 1.4250 May high return focus to the 1.4290/1.4300, Fibonacci retracement and October current year high
| Levels | Imp | Comment | Levels | Imp | Comment | |||
|---|---|---|---|---|---|---|---|---|
| R4 | 1.4450 | * | congestion | S1 | 1.4250 | * | congestion, May high | |
| R3 | 1.4400 | ** | congestion | S2 | 1.4200 | * | congestion | |
| R2 | 1.4350/60 | * | congestion, channel | S3 | 1.4140 | ** | Nov 2025 high | |
| R1 | 1.4290/00 | ** | 61.8%, 14 Oct YTD high | S4 | 1.4100 | * | congestion |
Asterisk denotes strength of level
07:10 GMT - Break above the 1.4250 May high return focus to the 1.4290/1.4300, Fibonacci retracement and October current year high. Both intrday and daily studies are stretched adnd suggest reaction at the latter likely. However, a later break cannot be ruled out to extend gains from the January year low towards 1.4350/60 congestion and channel resistance. Meanwhile, support remain is raised to the 1.4250 May high. Would take break here to ease the upside pressure and see fresh consolidation to support at 1.4200/1.4140, congestion and November 2025 high.