Published: 2026-06-08T00:28:35.000Z
Chart AUD/USD Update: Consolidating losses
2
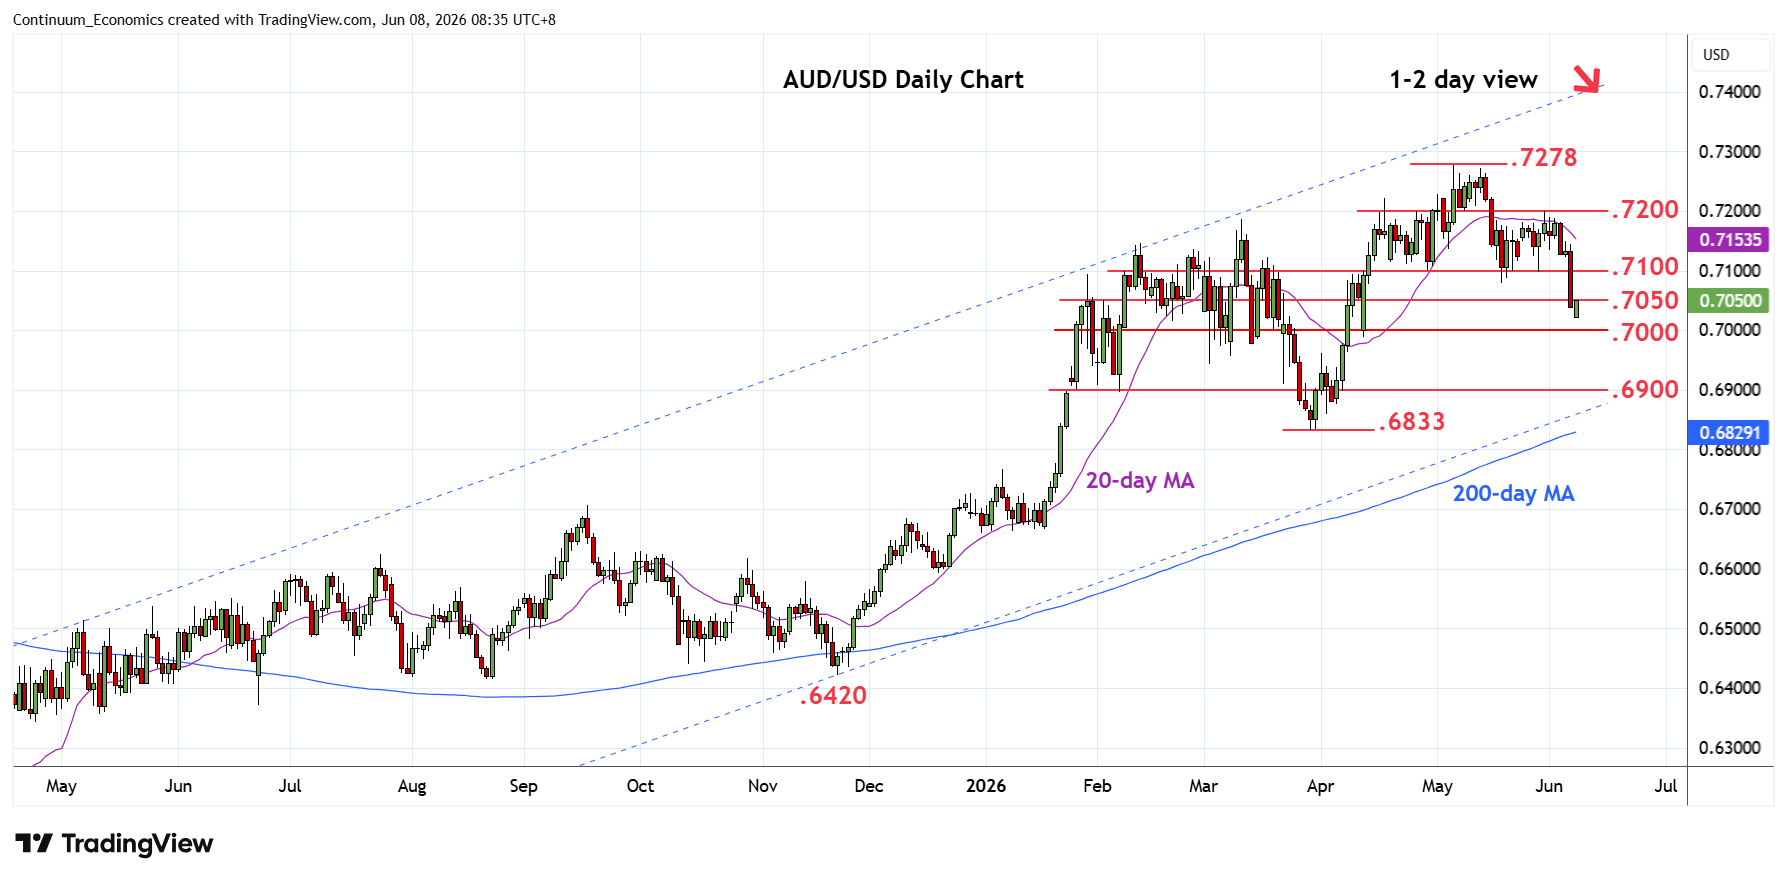
Weak opening has seen losses to .7020 low before turning higher to consolidate sharp losses last week from the .7200 resistance
| Levels | Imp | Comment | Levels | Imp | Comment | |||
|---|---|---|---|---|---|---|---|---|
| R4 | 0.7200 | ** | congestion, 29 May high | S1 | 0.7000 | ** | congestion, 61.8% | |
| R3 | 0.7150 | * | congestion | S2 | 0.6950 | * | congestion | |
| R2 | 0.7100 | ** | congestion | S3 | 0.6900 | * | congestion | |
| R1 | 0.7080 | * | May low | S4 | 0.6850/33 | ** | congestion, Mar low |
Asterisk denotes strength of level
00:15 GMT - Weak opening has seen losses to .7020 low before turning higher to consolidate sharp losses last week from the .7200 resistance. However, this is expected to give way to renewed selling pressure and see deeper pullback within the bull channel from April 2025 low to the .7000 figure and 61.8% Fibonacci retracement of the March/May rally. Lower still, will see room to .6950/00 congestion. Meanwhile, resistance is lowered to .7080/.7100 May low and congestion area which is expected to cap. Regaining this is needed to ease the downside pressure and see scope for recovery.