Published: 2026-09-22T01:54:01.000Z
Chart GBP/USD Update: Shallow bounce
2
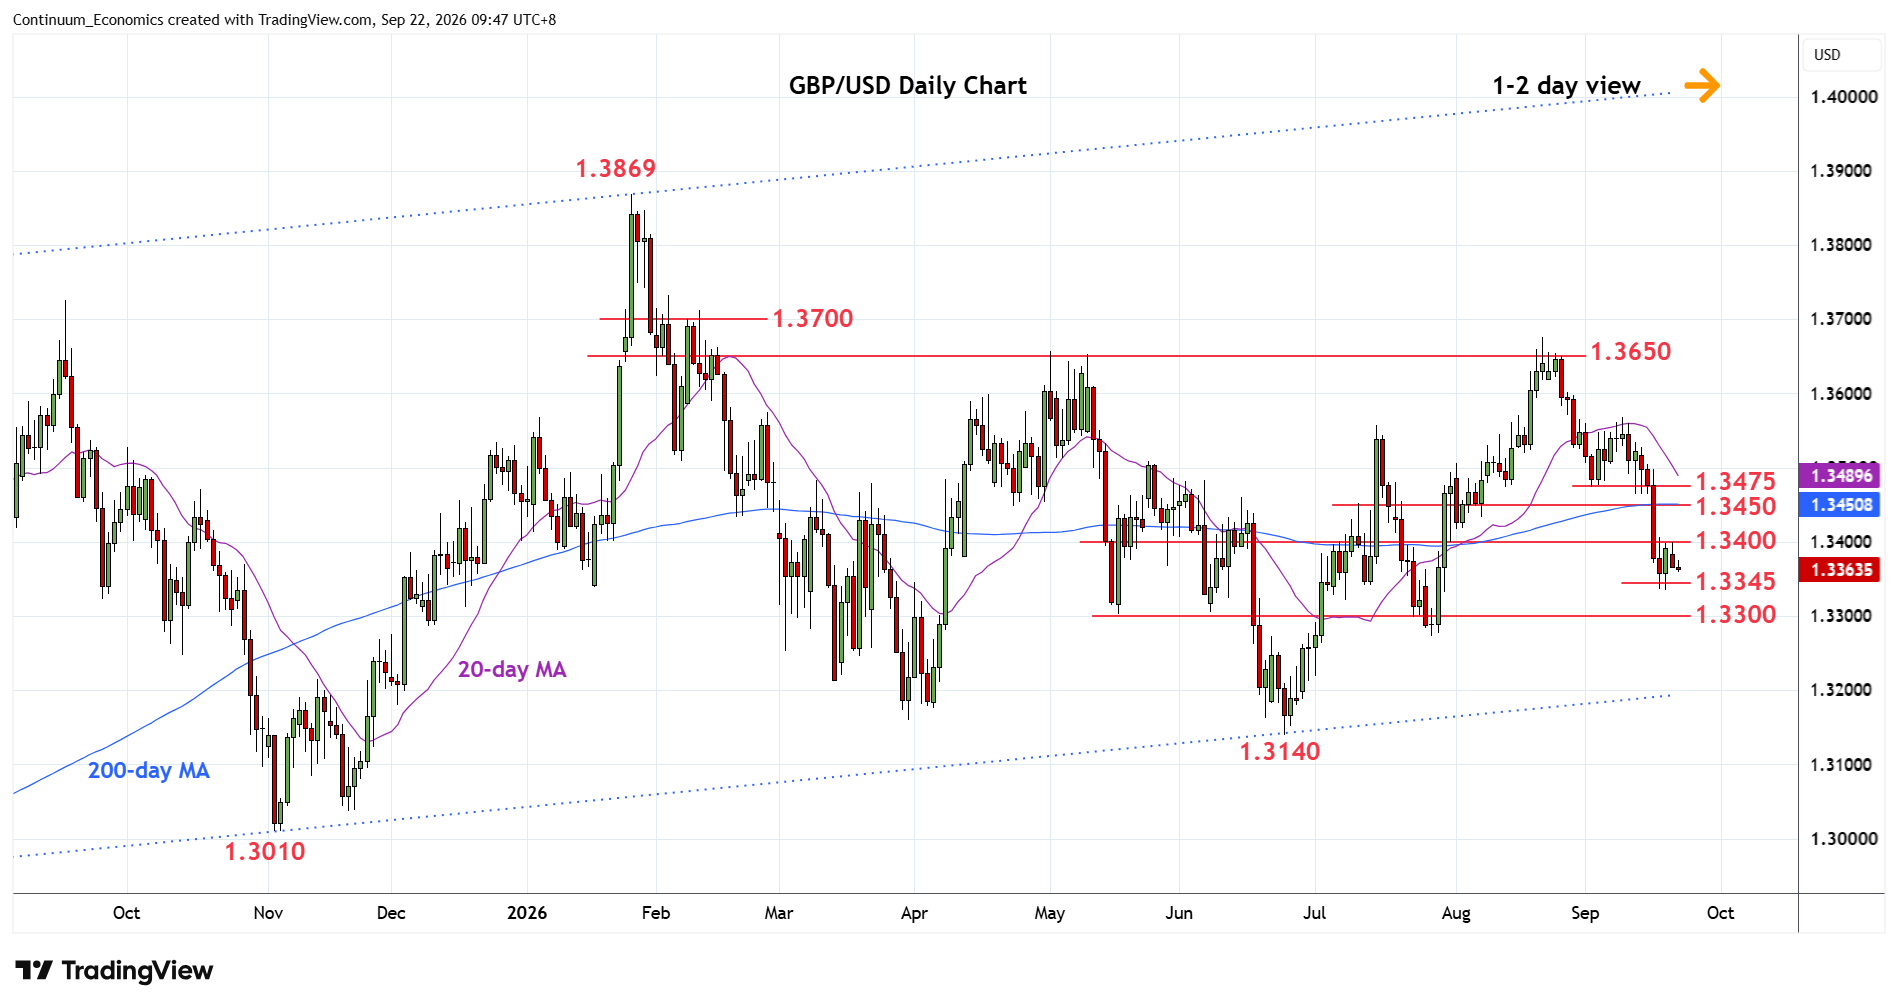
Little change, as prices hold a narrow range above the 1.3345/35, 61.8% Fibonacci level and Friday's low
| Level | Comment | Level | Comment | |||||
|---|---|---|---|---|---|---|---|---|
| R4 | 1.3500 | * | congestion | S1 | 1.3345 | * | 61.8% Jun/Aug rally | |
| R3 | 1.3475 | ** | 2 Sep low | S2 | 1.3300 | ** | congestion | |
| R2 | 1.3450 | * | congestion | S3 | 1.3273 | * | 28 Jul low | |
| R1 | 1.3400 | * | congestion | S4 | 1.3250 | * | congestion |
Asterisk denotes strength of level
01:50 GMT - Little change, as prices hold a narrow range above the 1.3345/35, 61.8% Fibonacci level and Friday's low. Resistance is at the 1.3400 level and regaining this will ease the downside pressure and see room for stronger bounce to retest previous support turned resistance at 1.3450/75 area. However, bearish structure from the 1.3675 August high keep pressure on the downside and correction is expected to give way to renewed selling pressure later to retrace the June/August rally. Lower will see room towards support at the 1.3300 level and 1.3273, late-July low.