Published: 2026-07-21T07:34:20.000Z
Chart EUR/AUD Update: Extending losses within a descending triangle
4
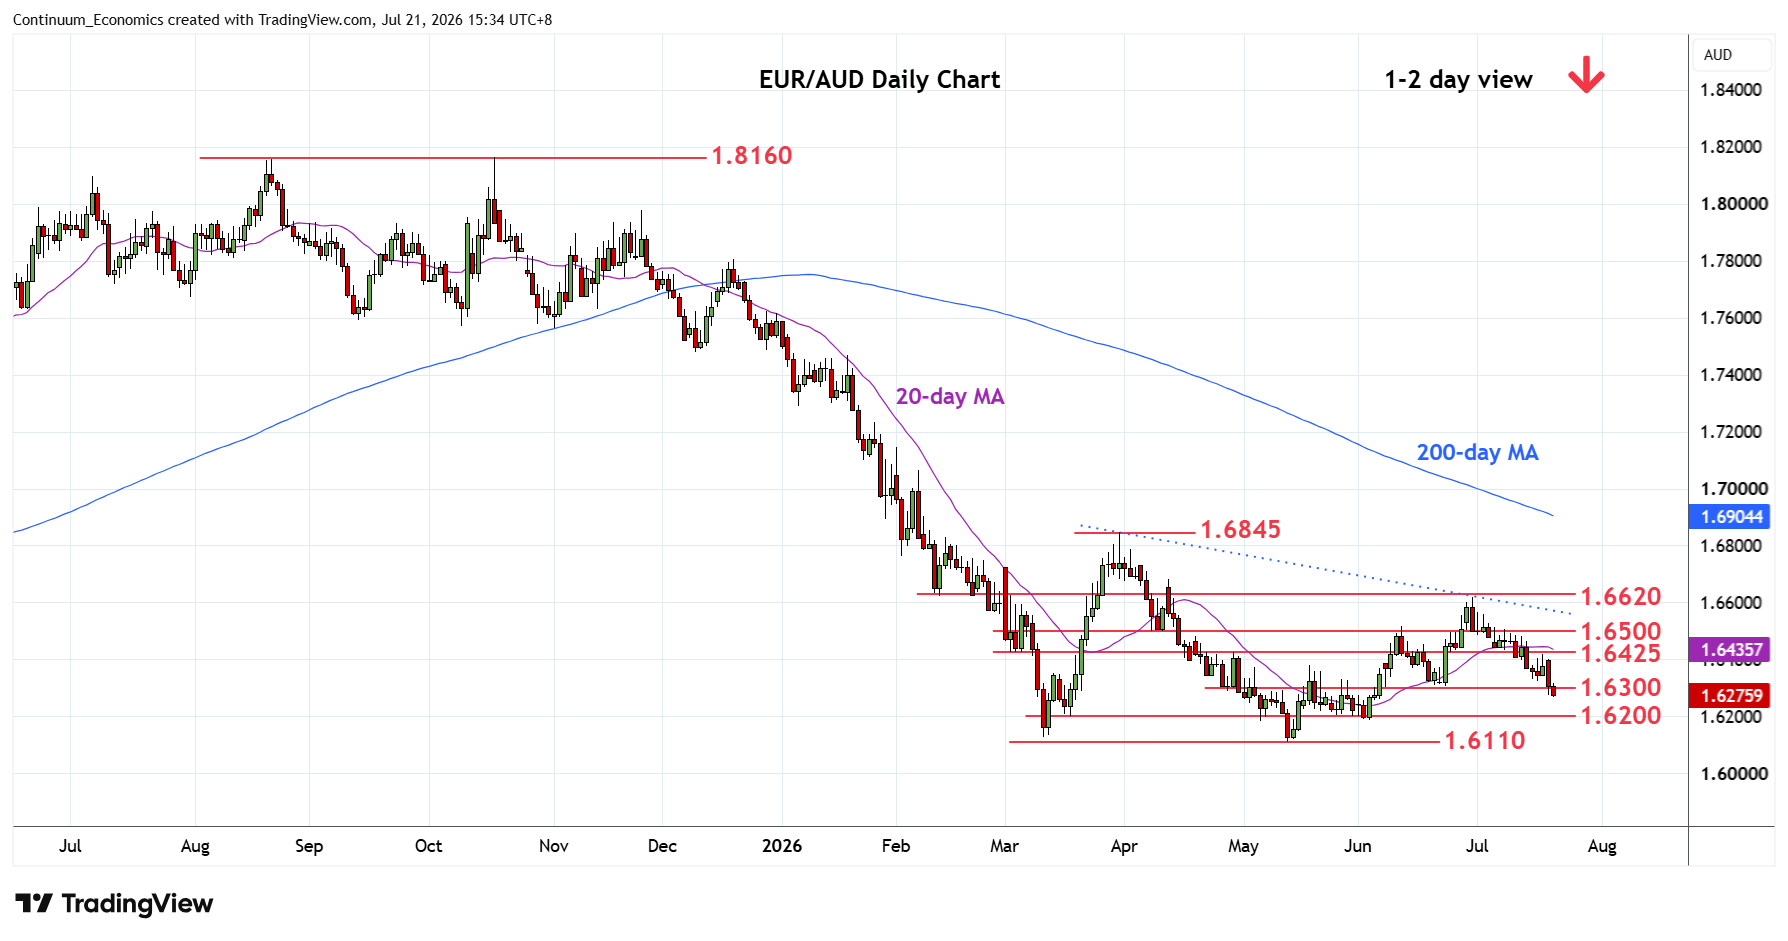
Consolidation above support at the 1.6305/00 area has met with renewed selling pressure to extend losses from the 1.6620 June swing high
| Levels | Imp | Comment | Levels | Imp | Comment | |||
|---|---|---|---|---|---|---|---|---|
| R4 | 1.6700 | * | congestion | S1 | 1.6250 | congestion | ||
| R3 | 1.6600/20 | ** | congestion, 30 Jun high | S2 | 1.6200 | * | congestion | |
| R2 | 1.6500 | * | congestion | S3 | 1.6110 | ** | 13 May YTD low | |
| R1 | 1.6400/25 | * | congestion | S4 | 1.6000 | ** | congestion |
Asterisk denotes strength of level
07:30 GMT - Consolidation above support at the 1.6305/00 area has met with renewed selling pressure to extend losses from the 1.6620 June swing high. Negative weekly studies keep pressure firmly on the downside within the March descending triangle pattern and lower will see room to support at the 1.6250/00 congestion area. Below this will return focus to the 1.6110, 13 May current year low. Break here will further extend losses from the April 2025 year high. Meanwhile, resistance is at the 1.6400/25 area should cap any corrective bounce.