Chart GBP/USD Update: Extending losses
Consolidation beneath 1.3400 has given way to further losses as intraday studies remain under pressure
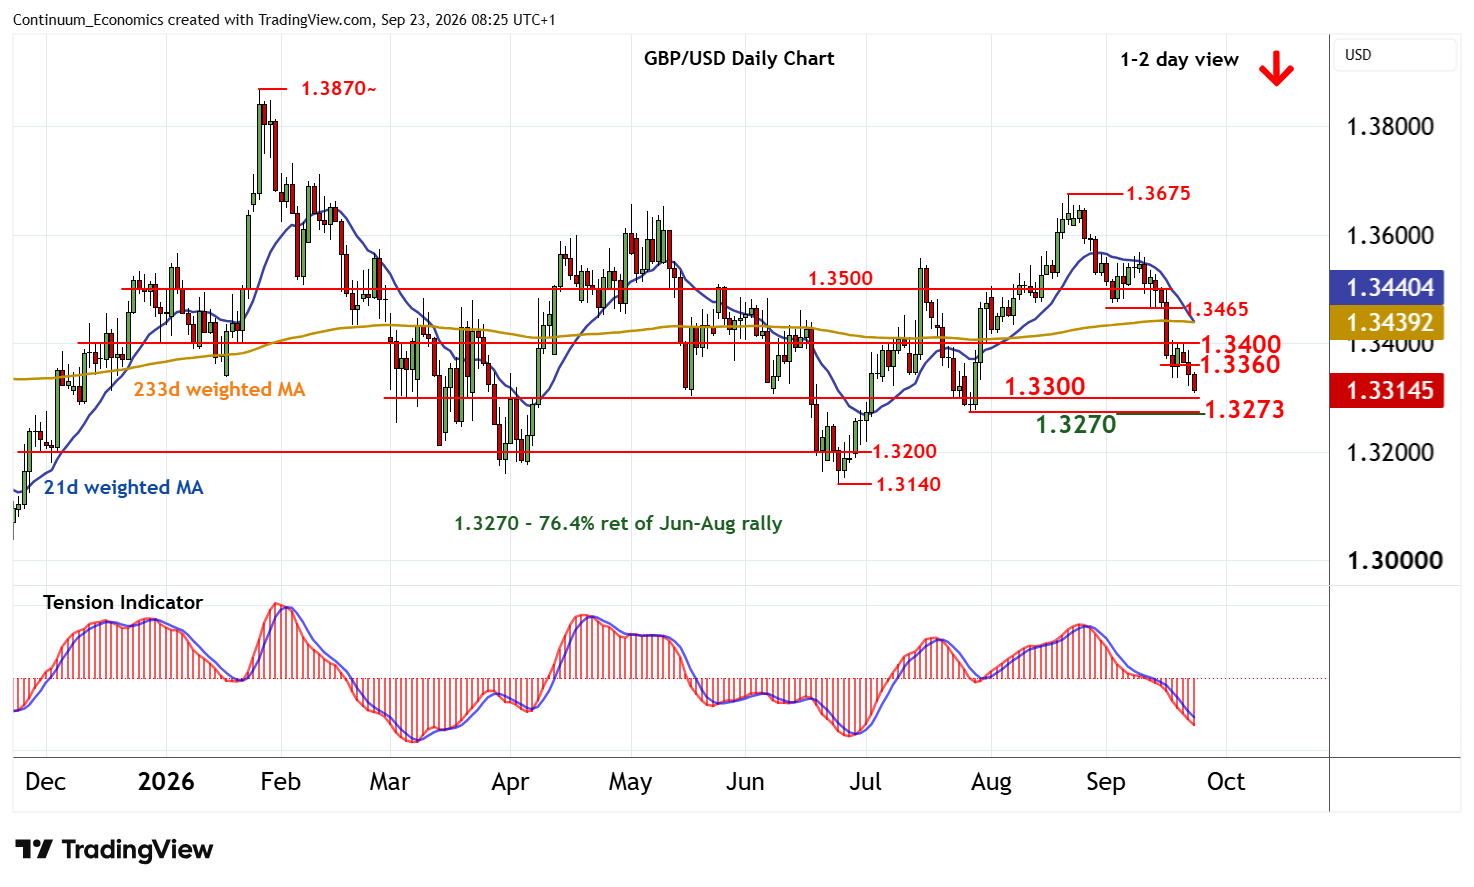
| Level | Comment | Level | Comment | |||||
|---|---|---|---|---|---|---|---|---|
| R4 | 1.3500 | * | congestion | S1 | 1.3300 | ** | congestion | |
| R3 | 1.3465 | * | recent lows | S2 | 1.3270/73 | ** | 76.4% ret; 28 Jul (w) low | |
| R2 | 1.3400 | ** | congestion | S3 | 1.3200 | ** | congestion | |
| R1 | 1.3360 | * | range lows | S4 | 1.3140 | ** | 24 Jun YTD low |
Asterisk denotes strength of level
08:10 BST - Consolidation beneath 1.3400 has given way to further losses as intraday studies remain under pressure, with prices approaching congestion support at 1.3300. Daily readings have turned lower once again and broader weekly charts are under pressure, highlighting room for a break and continuation of late-August losses towards strong support at the 1.3270 Fibonacci retracement and the 1.3273 weekly low of 28 July. Already oversold daily stochastics could limit any initial tests in short-covering/consolidation, before further losses are seen.
Meanwhile, resistance is lowered to the 1.3360 range lows and extends to congestion around 1.3400. This range should cap any immediate tests higher.