Published: 2026-05-28T08:16:38.000Z
Chart AUD/USD Update: Under pressure
1
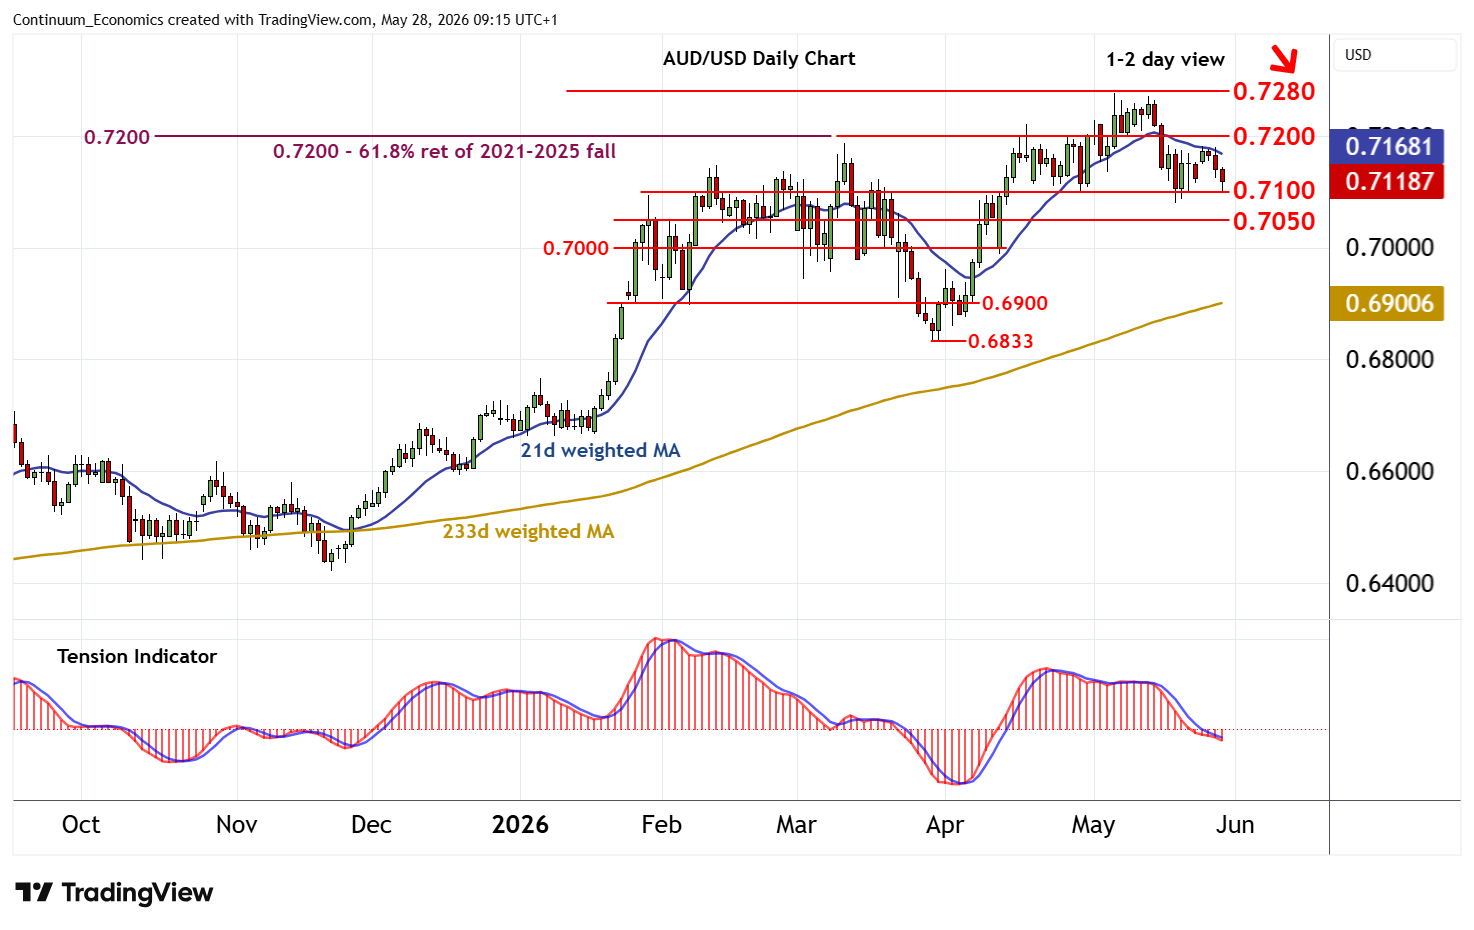
Anticipated losses have reached congestion support at 0.7100
| Levels | Imp | Comment | Levels | Imp | Comment | |||
|---|---|---|---|---|---|---|---|---|
| R4 | 0.7500 | ** | historic congestion | S1 | 0.7100 | congestion | ||
| R3 | 0.7400 | ** | historic congestion | S2 | 0.7050 | * | congestion | |
| R2 | 0.7280~ | ** | June 2022 high | S3 | 0.7000 | * | congestion | |
| R1 | 0.7200 | ** | break level, 61.8% ret | S4 | 0.6900 | * | congestion |
Asterisk denotes strength of level
09:05 BST - Anticipated losses have reached congestion support at 0.7100, where oversold intraday studies are prompting short-term reactions. Daily readings have turned down and broader weekly charts are bearish, highlighting room for further losses in the coming sessions. A close beneath here will add weight to sentiment and extend early-May losses initially towards further congestion around 0.7050. Meanwhile, resistance remains at 0.7200 and should cap any immediate tests higher.