Weekly Chart USD Index DXY: Consolidating gains - background studies remain positive
The anticipated continuation of late-August gains has met selling interest just beneath strong resistance at 101.50,
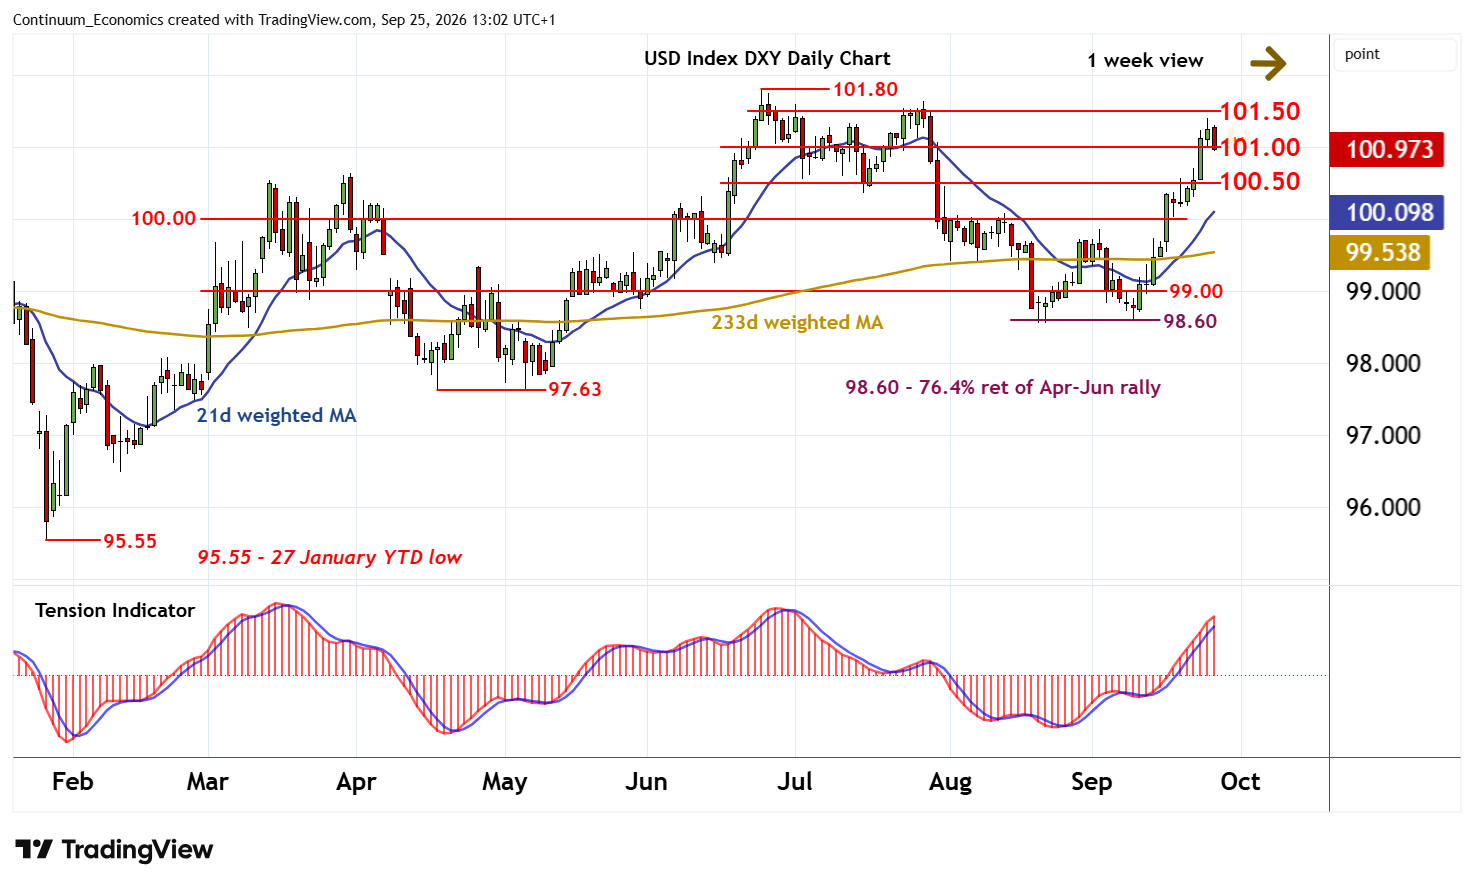
with prices settling back towards congestion support at 101.00.
Overbought daily stochastics are turning down, highlighting room for a break beneath here towards the 100.50 break level. However, the daily Tension Indicator continues to rise and broader weekly charts are positive, suggesting any initial tests should give way to renewed buying interest/consolidation. A close beneath here, if seen, will add weight to sentiment and prompt a deeper retracement, with focus turning to congestion around 100.00.
Following cautious/corrective trade, fresh gains are looked for.
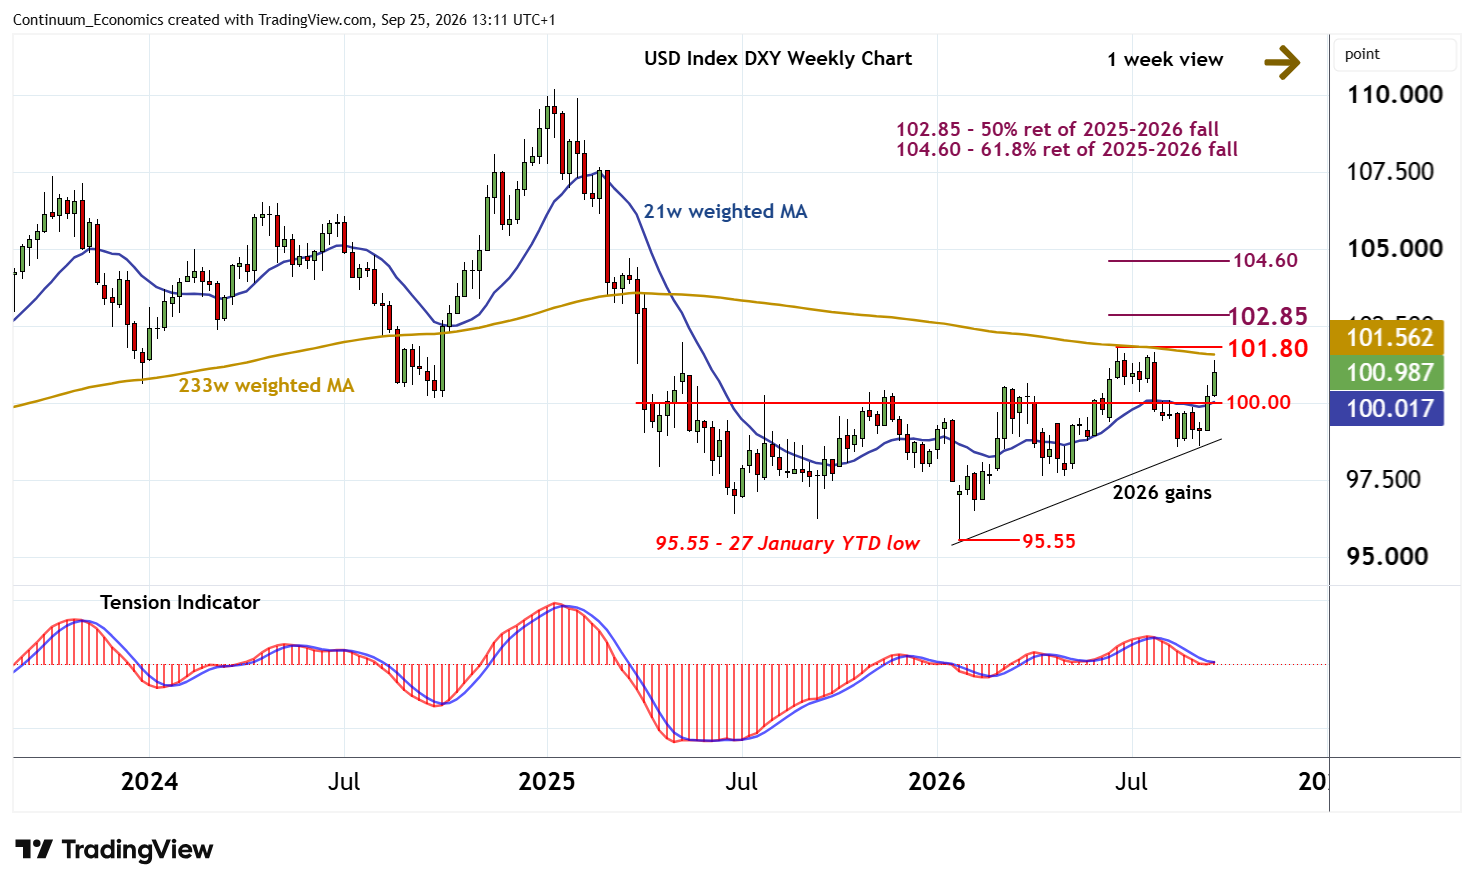
Critical resistance is at the 101.80 current year high of 24 June. A close above here will turn sentiment positive and confirm continuation of gains from the 95.55 current year low of 27 January. Focus will then turn to strong resistance at the 102.85 Fibonacci retracement. However, mixed longer-term charts could limit any initial tests in profit-taking/consolidation, before January gains resume.