Published: 2026-07-29T06:54:48.000Z
Chart AUD/JPY Update: Lower in consolidation beneath 114.90 high
3
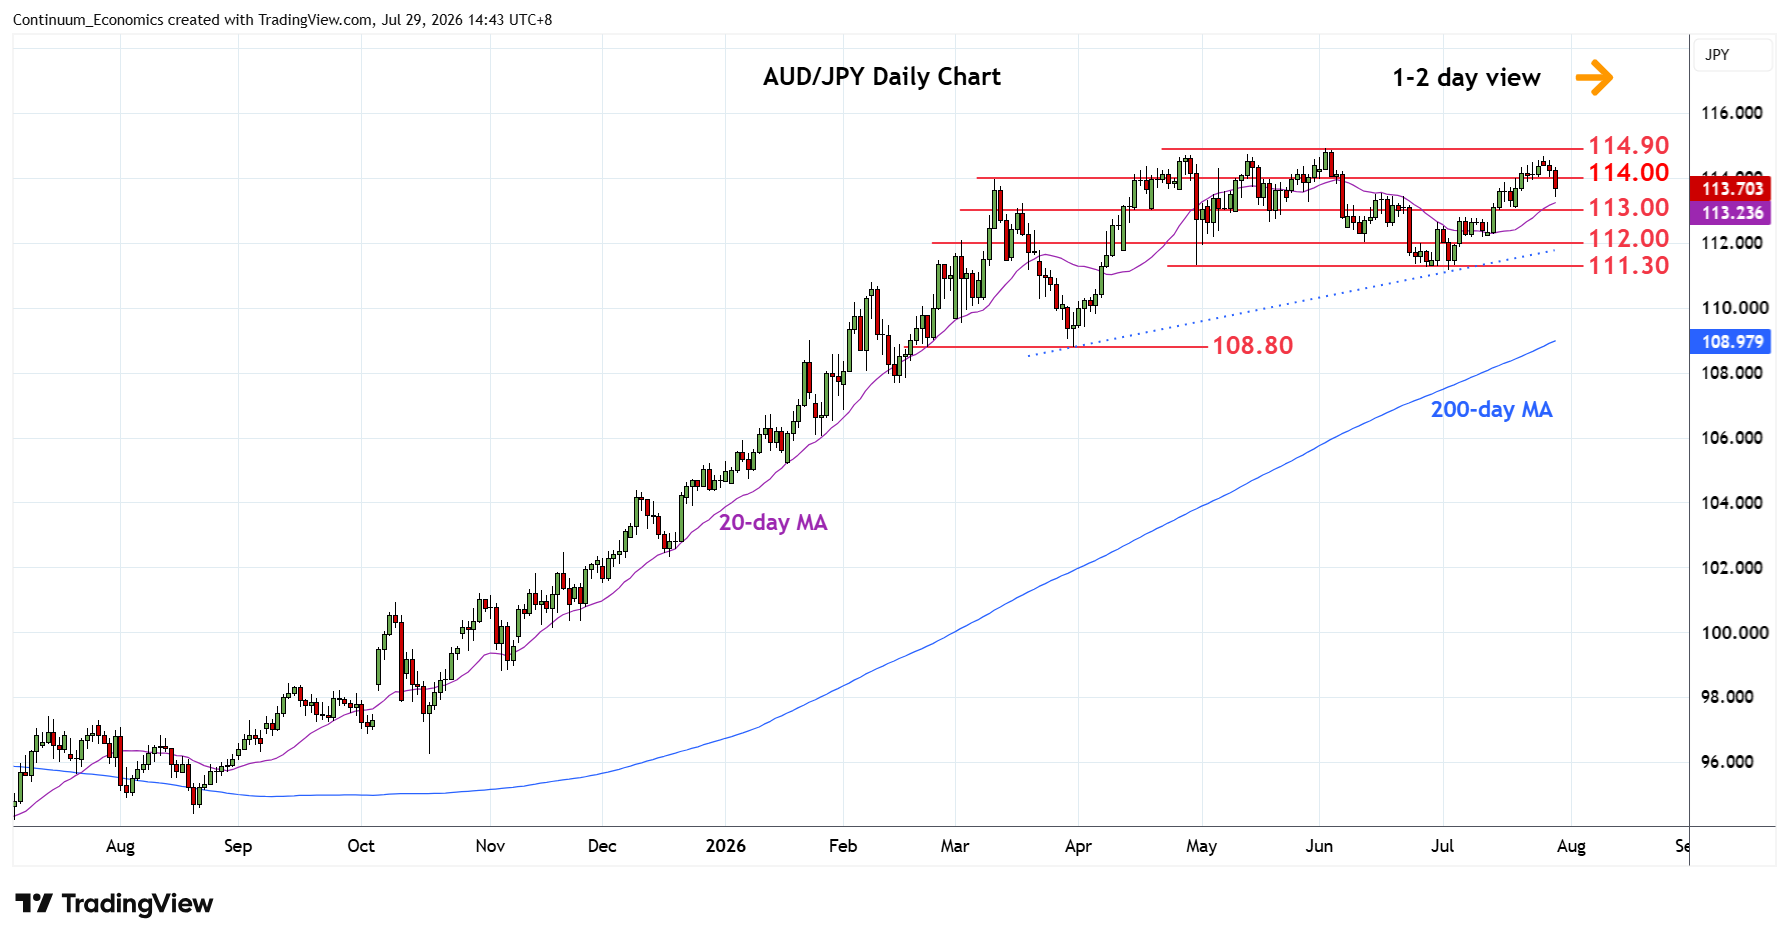
Consolidation beneath the 114.70/90 highs has given way selling pressure as prices unwind overbought intraday and daily studies
| Levels | Imp | Comment | Levels | Imp | Comment | |||
|---|---|---|---|---|---|---|---|---|
| R4 | 118.00 | * | congestion | S1 | 113.50/00 | * | congestion | |
| R3 | 116.00 | * | congestion | S2 | 112.00 | * | congestion | |
| R2 | 114.90 | ** | 2 Jun YTD high | S3 | 111.30/15 | ** | 30 Apr, 2 Jul lows | |
| R1 | 114.65 | * | 27 Jul high | S4 | 110.00 | * | congestion |
Asterisk denotes strength of level
06:50 GMT - Consolidation beneath the 114.70/90 highs has given way selling pressure as prices unwind overbought intraday and daily studies. Below the 114.00 level has seen deeper pullback to support at the 113.50/113.00 congestion area. Would take break here to fade the upside pressure and see deeper pullback to support at the 112.00 level and the 111.30/15 lows. Meanwhile, break above the 114.65 and 114.90 highs, if seen, will extend gains from the 2020 year low and see room to target the 116.00/118.00 congestion area.