Published: 2026-07-10T08:17:25.000Z
Chart USD Index DXY Update: Consolidating test of support - studies under pressure
2
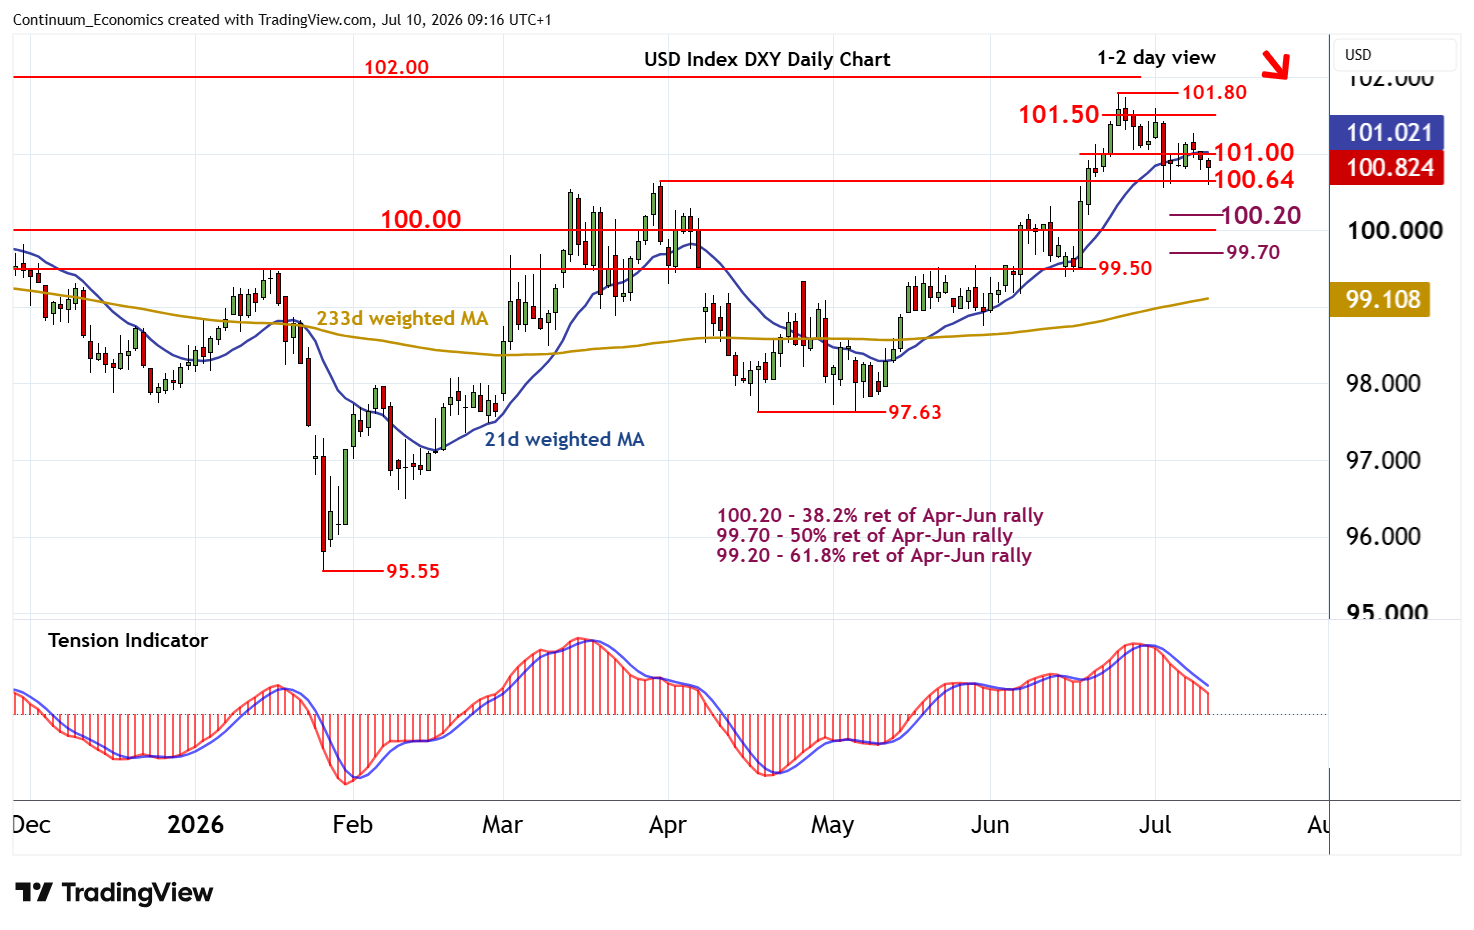
The anticipated test of support at the 100.64 monthly low of 31 March is giving way to consolidation
| Levels | Imp | Comment | Levels | Imp | Comment | |||
|---|---|---|---|---|---|---|---|---|
| R4 | 102.00 | ** | congestion | S1 | 100.64 | ** | 31 Mar (m) high | |
| R3 | 101.80 | * | 24 Jun YTD high | S2 | 100.20 | ** | 38.2% ret of Apr-Jun rally | |
| R2 | 101.50 | intraday break level | S3 | 100.00 | ** | congestion | ||
| R1 | 101.00 | ** | congestion base | S4 | 99.70 | ** | 50% ret of Apr-Jun rally |
Asterisk denotes strength of level
08:55 BST - The anticipated test of support at the 100.64 monthly low of 31 March is giving way to consolidation, as oversold intraday studies flatten, with prices currently balanced around 100.80. Daily studies continue to track lower and overbought weekly stochastics are unwinding, pointing to room for further losses in the coming sessions. A close beneath here will add weight to sentiment and extend late-June losses towards the 100.00 - 100.20 range. Meanwhile, resistance remains at 101.00. A close back above here would help to stabilise price action and prompt consolidation beneath resistance at 101.50.