Published: 2026-10-29T02:27:49.000Z
Chart GBP/USD Update: Steadied at 1.3300/1.3273 support
1
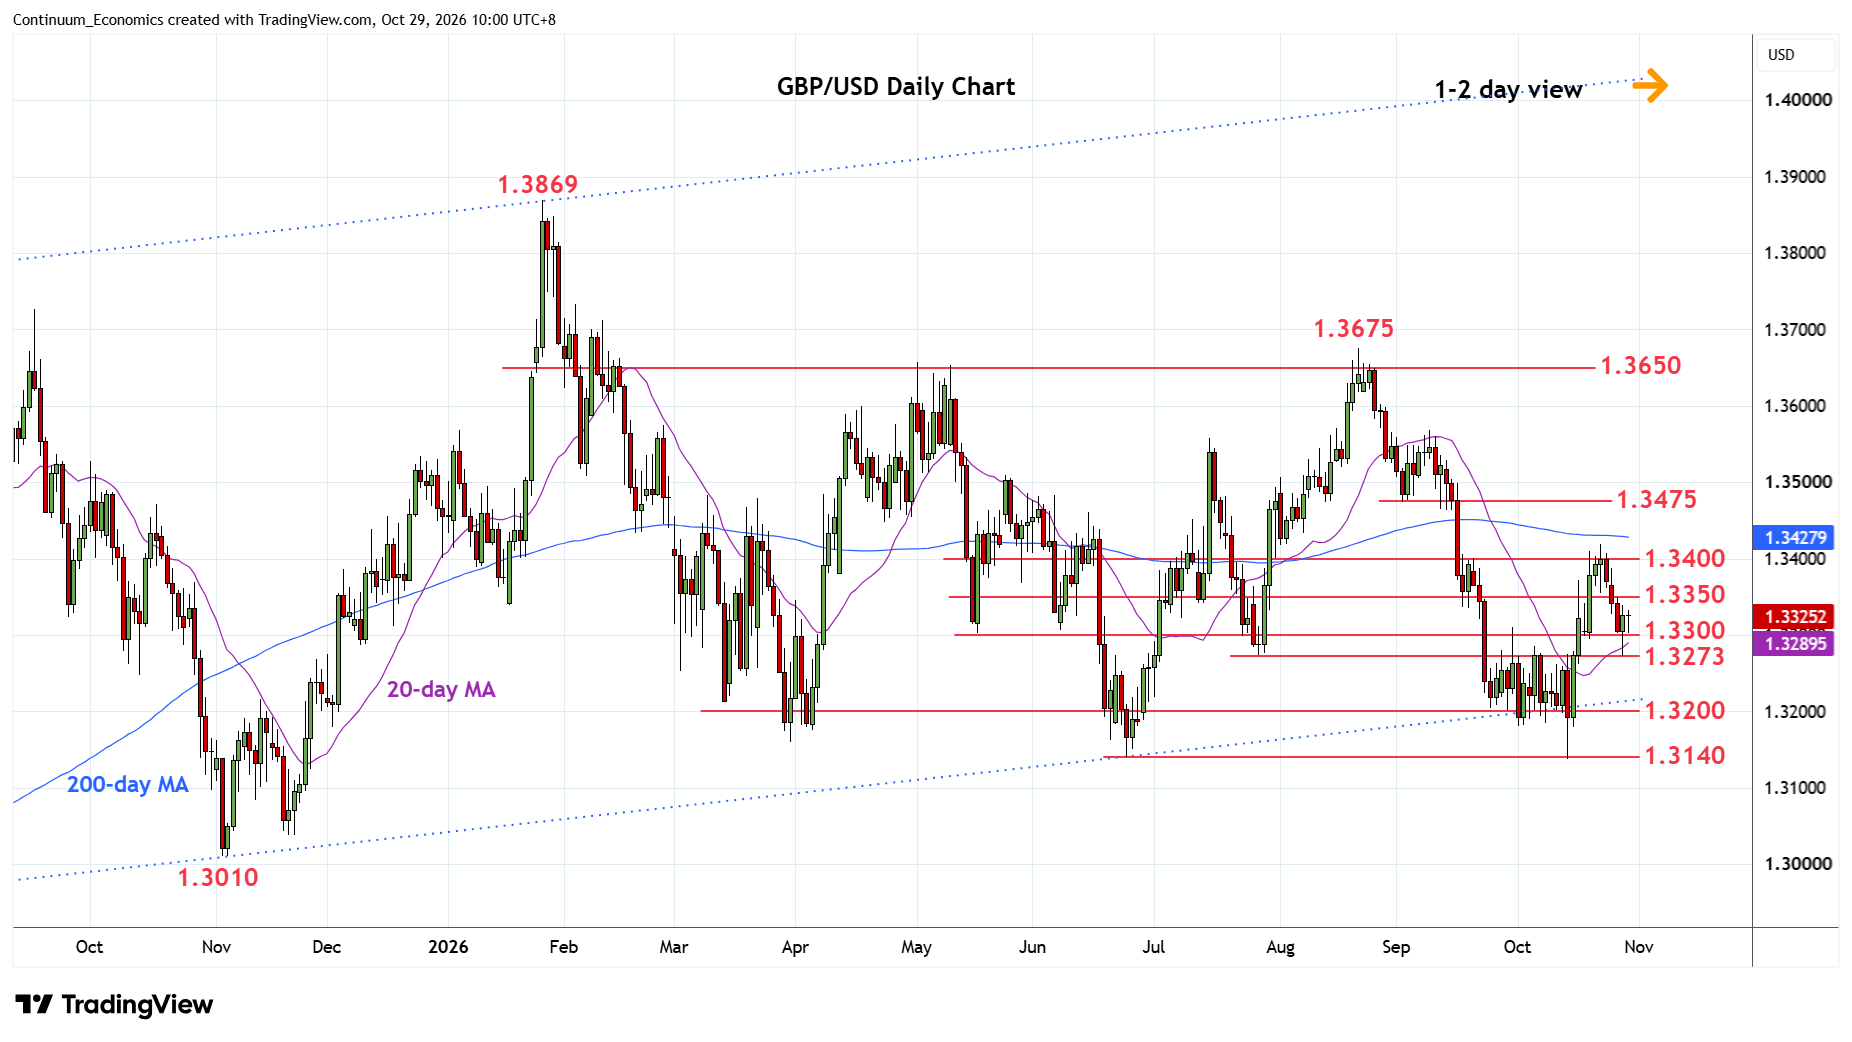
Test of strong support at the 1.3300/1.3273 congestion and 28 July low has given way to bounce as prices consolidate losses from the 1.3420 swing high
| Level | Comment | Level | Comment | |||||
|---|---|---|---|---|---|---|---|---|
| R4 | 1.3475 | ** | 2 Sep low | S1 | 1.3300 | ** | congestion | |
| R3 | 1.3450 | * | congestion | S2 | 1.3273 | * | 28 Jul low | |
| R2 | 1.3400 | ** | congestion | S3 | 1.3200 | * | congestion | |
| R1 | 1.3350 | * | congestion | S4 | 1.3140/37 | ** | Jun, 14 Oct YTD lows |
Asterisk denotes strength of level
02:20 GMT - Test of strong support at the 1.3300/1.3273 congestion and 28 July low has given way to bounce as prices consolidate losses from the 1.3420 swing high of last week. Pin bar from the 1.3273 support suggest scope for stronger bounce to the 1.3350 resistance. Clearance here will revive upside focus and sets up scope for retest of the 1.3400 level and 1.3420 high. Meanwhile, support at the 1.3300/1.3273 area should underpin. Failure here will see room for slide to retest of the 1.3200 channel support from the November low.