Chart USD/CAD Update: Lower in both USD- and CAD-driven trade
Consolidation around congestion resistance at 1.3900 has given way to a sharp fall in both USD- and CAD-driven trade
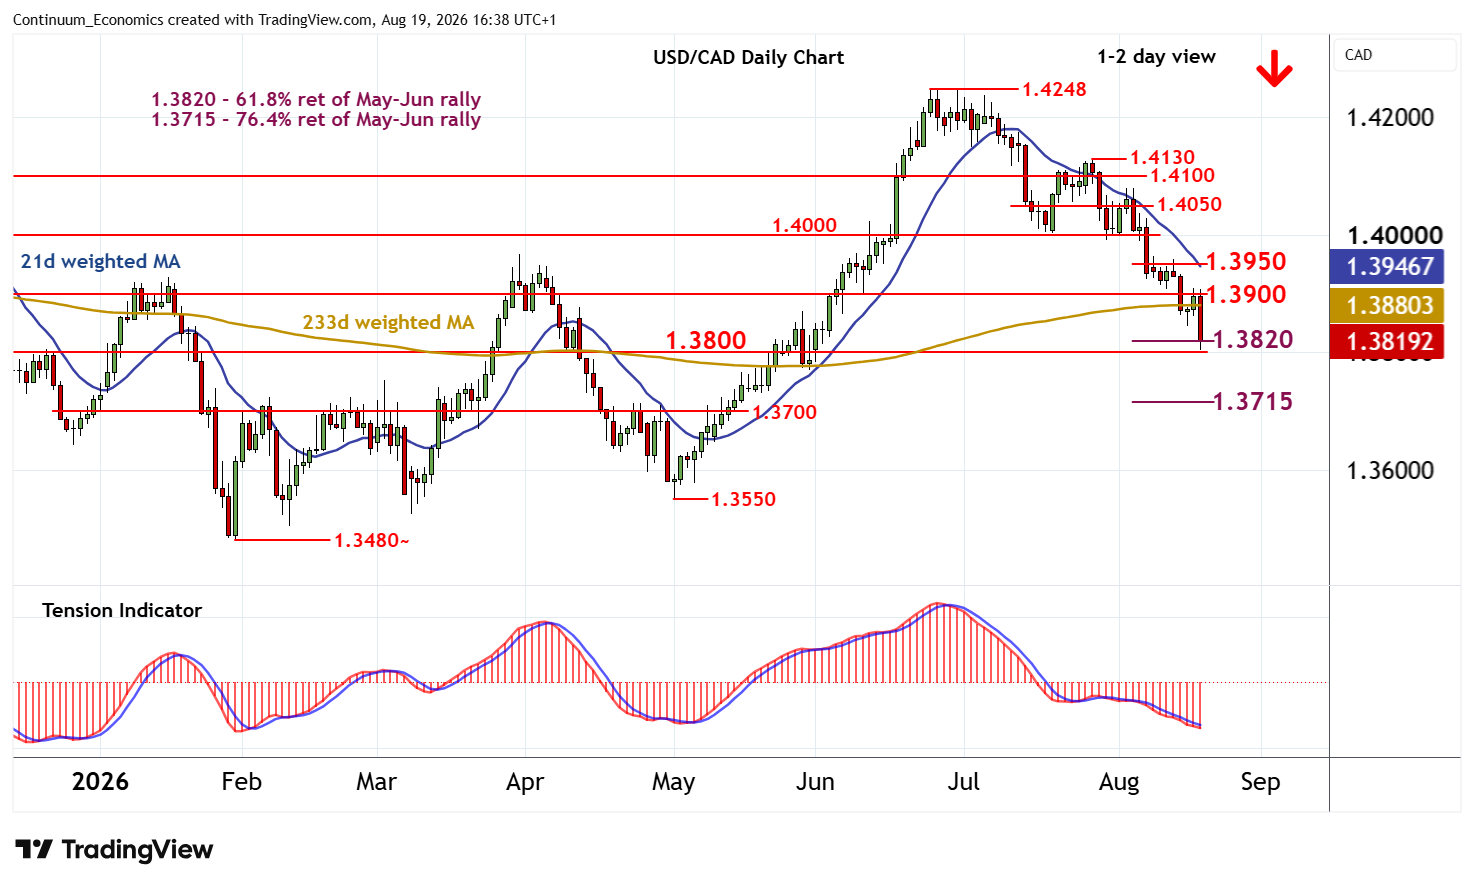
| Levels | Imp | Comment | Levels | Imp | Comment | |||
|---|---|---|---|---|---|---|---|---|
| R4 | 1.4050 | break level | S1 | 1.3820 | ** | 61.8% ret of May-Jun rally | ||
| R3 | 1.4000 | ** | break level | S2 | 1.3800 | ** | congestion | |
| R2 | 1.3950 | congestion | S3 | 1.3715 | ** | 76.4% ret of May-Jun rally | ||
| R1 | 1.3900 | * | congestion | S4 | 1.3700 | ** | congestion |
Asterisk denotes strength of level
16:30 BST - Consolidation around congestion resistance at 1.3900 has given way to a sharp fall in both USD- and CAD-driven trade, with prices currently pressuring support at congestion around 1.3800 and the 1.3820 Fibonacci retracement. Daily readings mixed/negative and broader weekly charts charts continue to fall, highlighting room for still deeper losses in the coming sessions. A close beneath here will add weight to sentiment and extend late-June losses towards the 1.3715 retracement.
Meanwhile, an unexpected close above 1.3900 will help to stabilise price action and prompt consolidation beneath further congestion around 1.3950.