Weekly Chart AUD/USD: Weighing on .6565/.6833, June/March lows
Losses through the .6900 level has seen extension to retest the .6865/.6833 June and March lows
Losses through the .6900 level has seen extension to retest the .6865/.6833 June and March lows, before turning to consolidate at the .6900 level and unwind oversold daily studies.
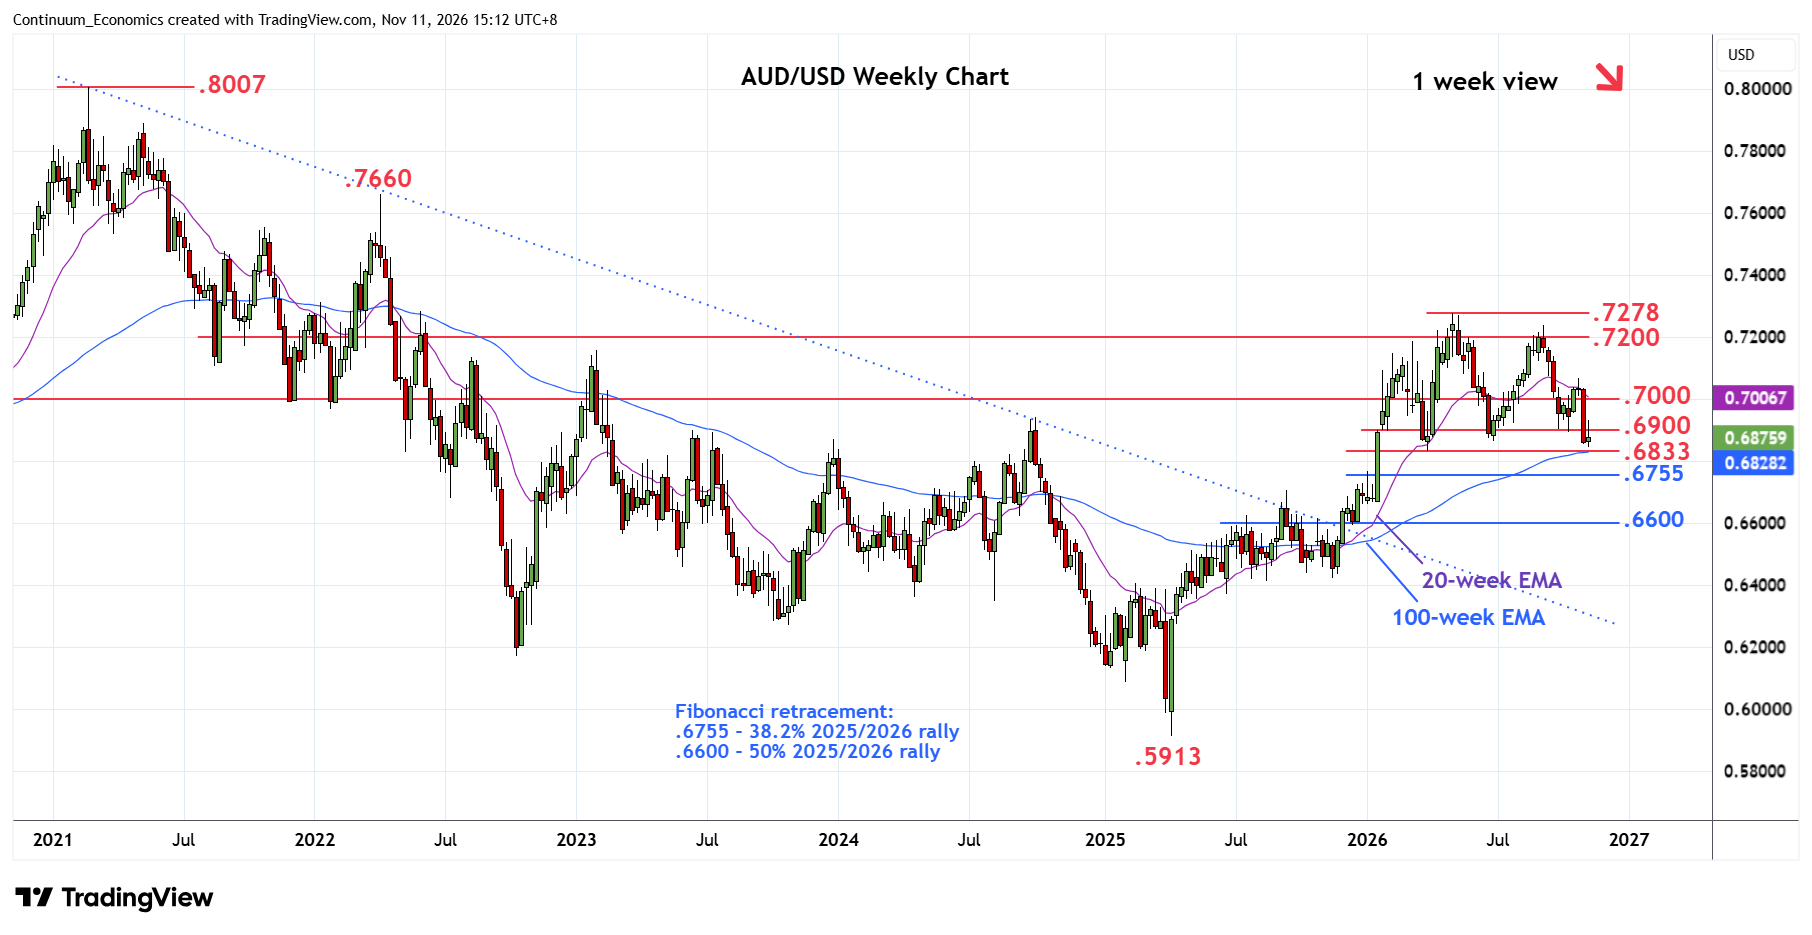
However, pressure remains on the downside and see risk for break here to open up room for deeper correction of the gains from the April 2025 year low. Lower will see room to the .6800 level then .6755, 38.2% Fibonacci retracement. Below here is the .6700 level then the strong support at .6650/.6600 congestion and 50% Fibonacci level as well as previous trendline resistance turned support.
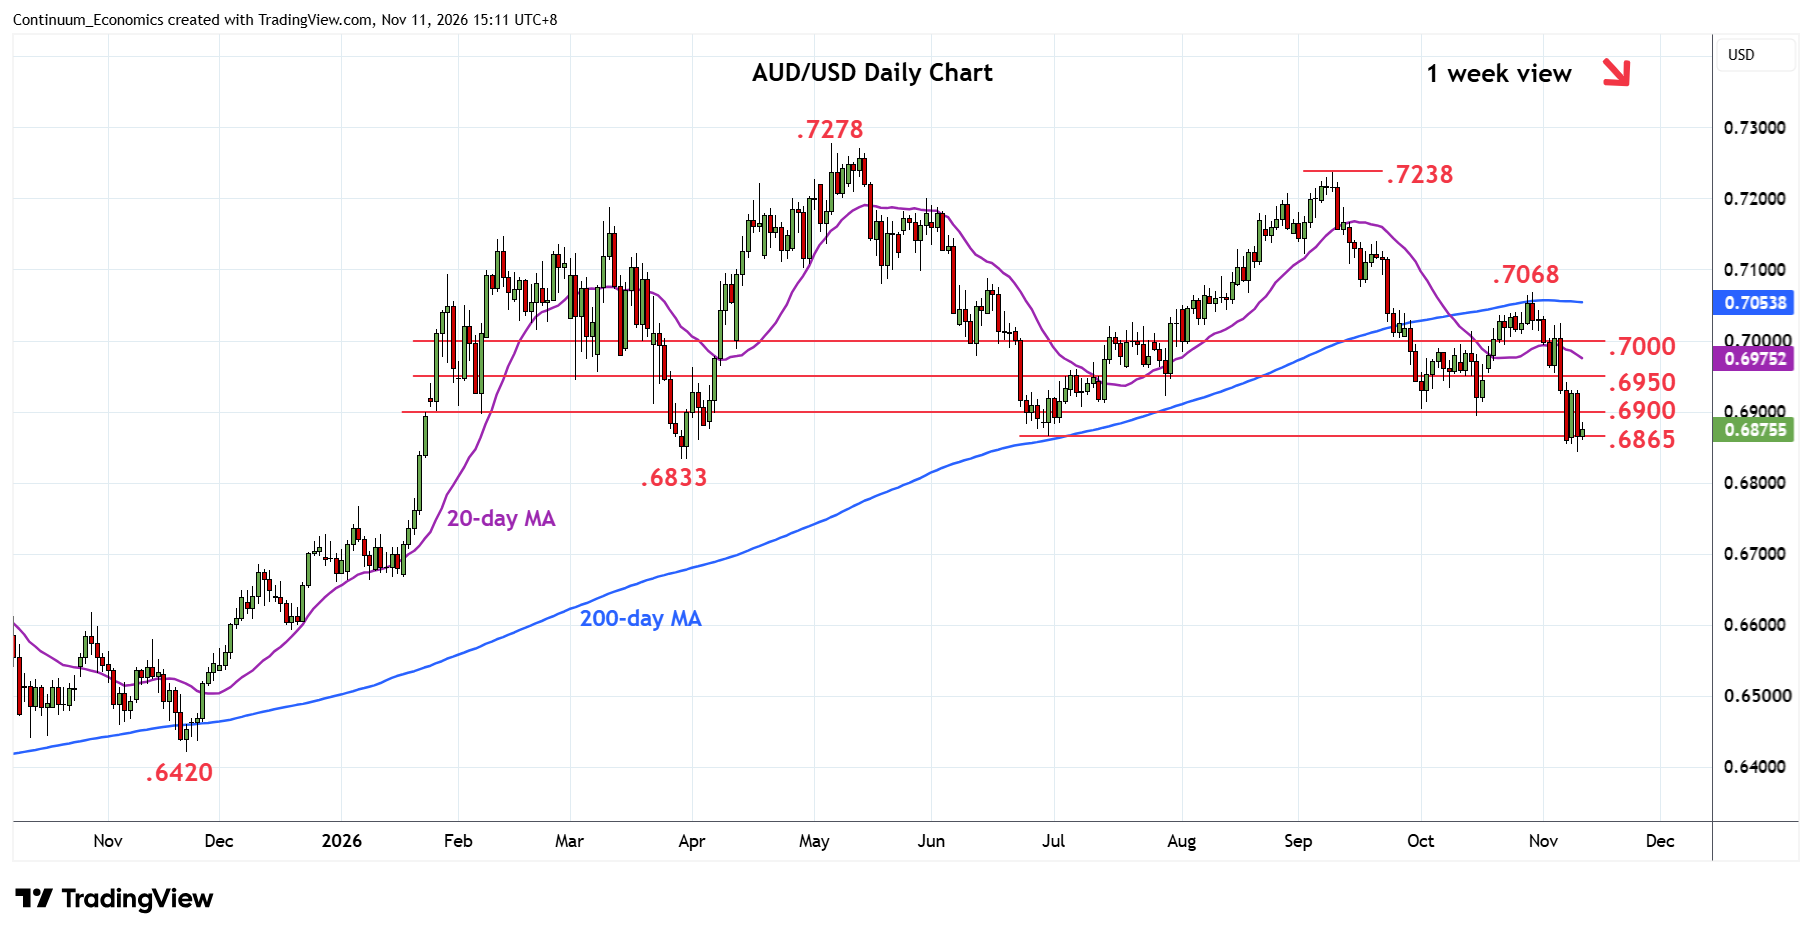
The latter expected to limit corrective pullback and give way to renewed buying interest later to resistance starting at the .6950 congestion. Regaining this will revive upside focus for retest of the .7000 level then the strong resistance at .7068, October high. Above these will return focus to the upside and see room for extension to the .7100/.7150 congestion area.