Published: 2026-09-04T07:22:47.000Z
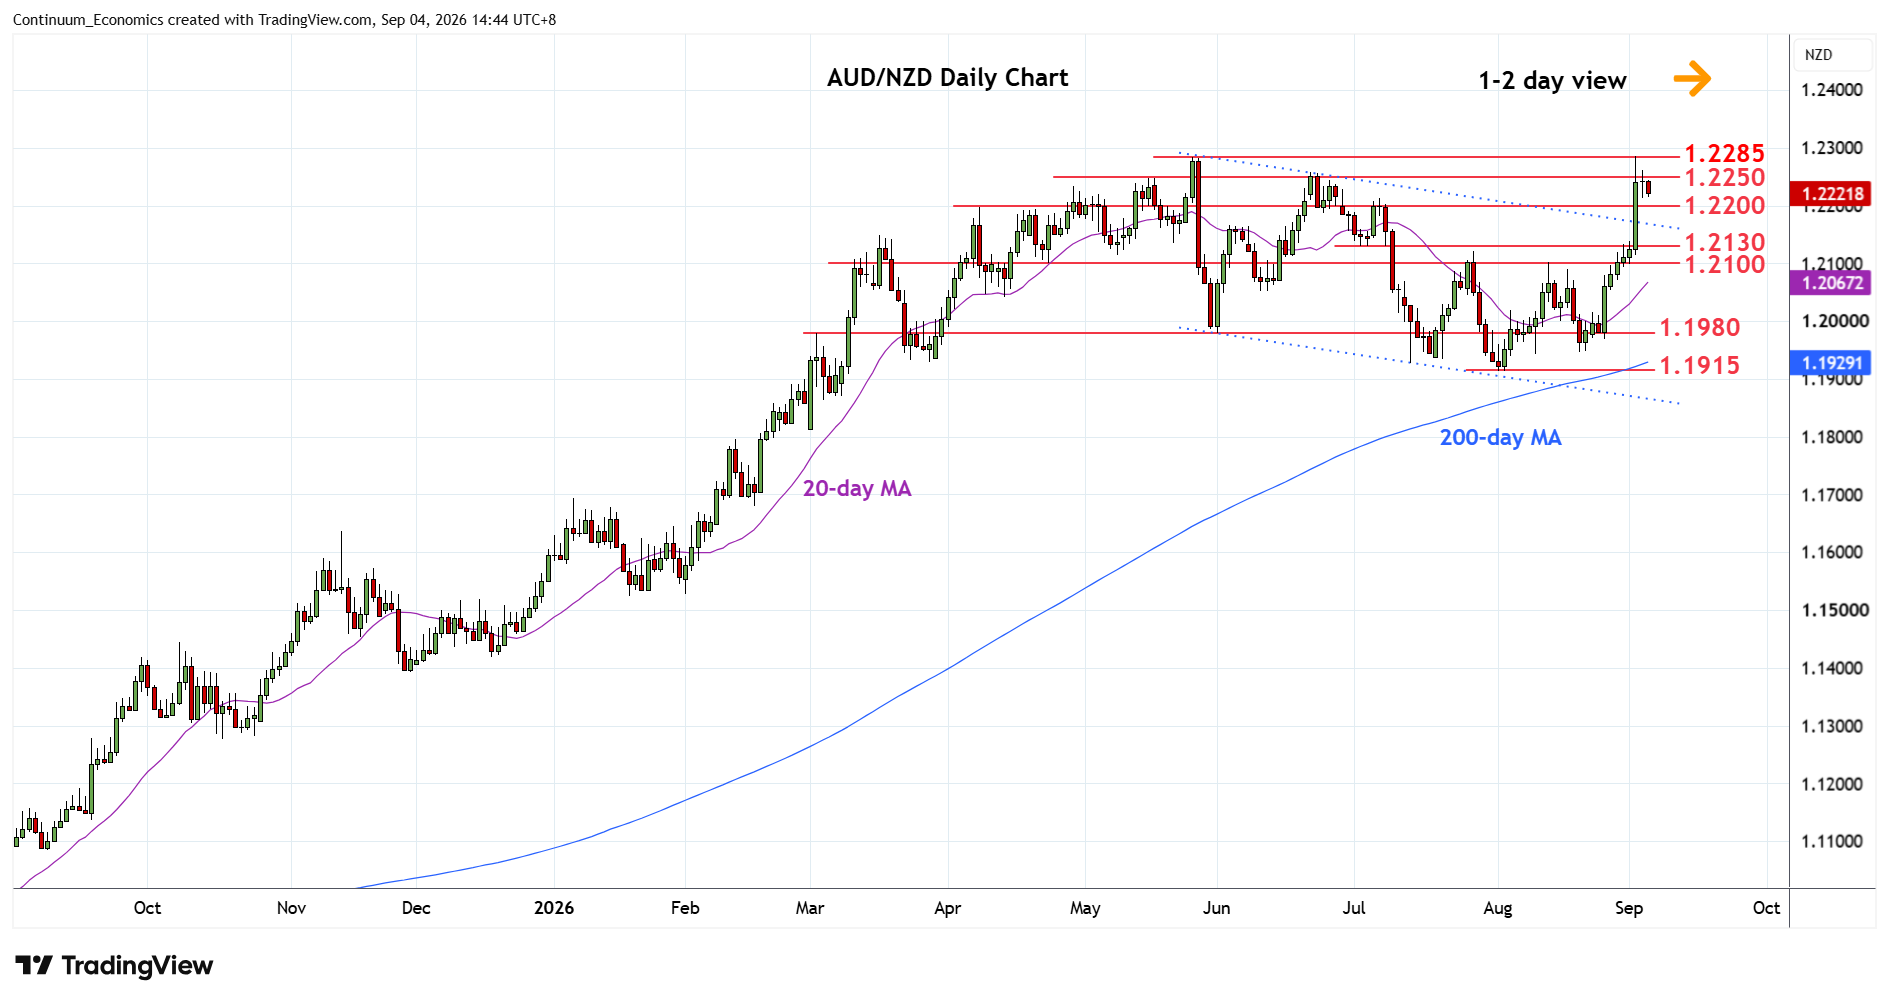
Chart AUD/NZD Update: Consoldidating retest of 1.2285, May YTD high
1
Lower in consolidation following retest of the 1.2285 May current year high as prices unwind overbought intraday studies
| Level | Comment | Level | Comment | |||||
|---|---|---|---|---|---|---|---|---|
| R4 | 1.2345 | * | 61.8% 2011/2020 fall | S1 | 1.2200 | congestion | ||
| R3 | 1.2300 | * | congestion | S2 | 1.2130/00 | ** | congestion, 13 Aug high | |
| R2 | 1.2285 | ** | 26 May YTD high | S3 | 1.2050 | * | congestion | |
| R1 | 1.2250 | * | congestion | S4 | 1.1980 | ** | Jun low |
Asterisk denotes strength of level
07:00 GMT - Lower in consolidation following retest of the 1.2285 May current year high as prices unwind overbought intraday studies. Daily studies are stretched as well and highlight scope for break of support at the 1.2200 level. Below here will open up room to strong support at the 1.2130/1.2100 congestion which should underpin. Meanwhile, resistance at the 1.2250/1.2285 highs expected to cap. Clearance here will extend the broader gains from the 2020 year low and see room to target the 1.2300 level. Higher still, will see extension to 1.2345, 61.8% Fibonacci level.