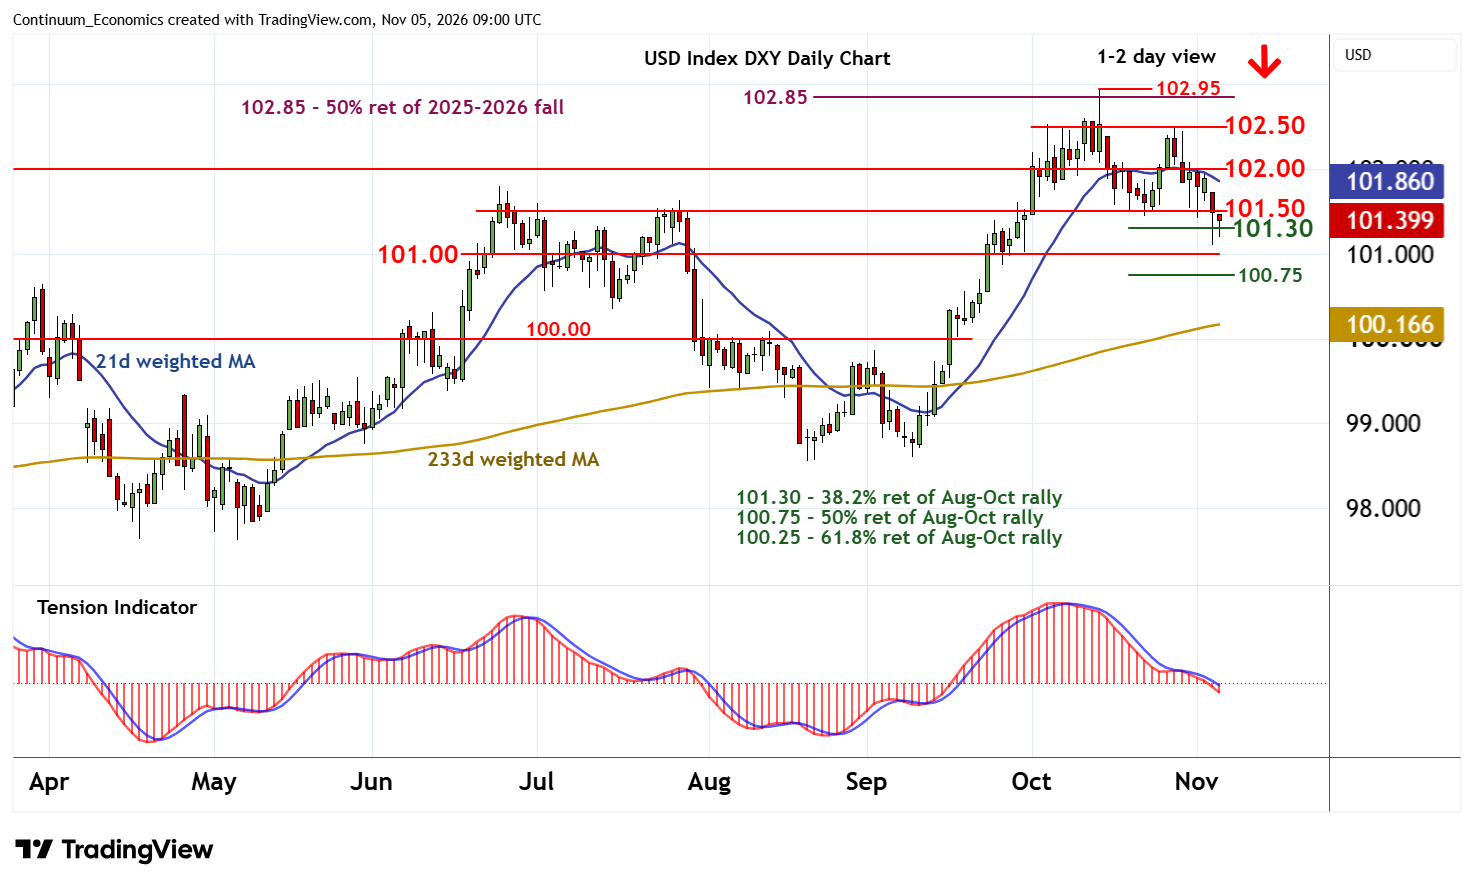
Chart USD Index DXY Update: Pressuring support
Little change, as prices extend cautious trade within support at the 101.30 Fibonacci retracement and the 101.50 break level
| Levels | Imp | Comment | Levels | Imp | Comment | |||
|---|---|---|---|---|---|---|---|---|
| R4 | 102.95/00 | ** | 14 Oct YTD high; congestion | S1 | 101.50 | * | break level | |
| R3 | 102.85 | ** | 50% ret of 2025-2026 fall | S2 | 101.30 | * | 38.2% ret of Aug-Oct rally | |
| R2 | 102.50 | congestion | S3 | 101.00 | ** | congestion | ||
| R1 | 102.00 | ** | congestion | S4 | 100.75 | * | 50% ret of Aug-Oct rally |
Asterisk denotes strength of level
08:35 GMT - Little change, as prices extend cautious trade within support at the 101.30 Fibonacci retracement and the 101.50 break level. Daily readings are negative and overbought weekly stochastics are unwinding, highlighting a deterioration in sentiment and room for further losses in the coming sessions. A close below 101.30 will add weight to already bearish price action and extend losses from the 102.95 current year high of 14 October below congestion around 101.00 towards the 100.75 retracement.
Meanwhile, resistance remains up to congestion around 102.00 and should cap any immediate tests higher. An unexpected close above here would help to stabilise price action and prompt fresh consolidation beneath further congestion around 102.50.