Published: 2026-10-09T00:38:23.000Z
Chart USD/JPY Update: Coiled around 158.00
1
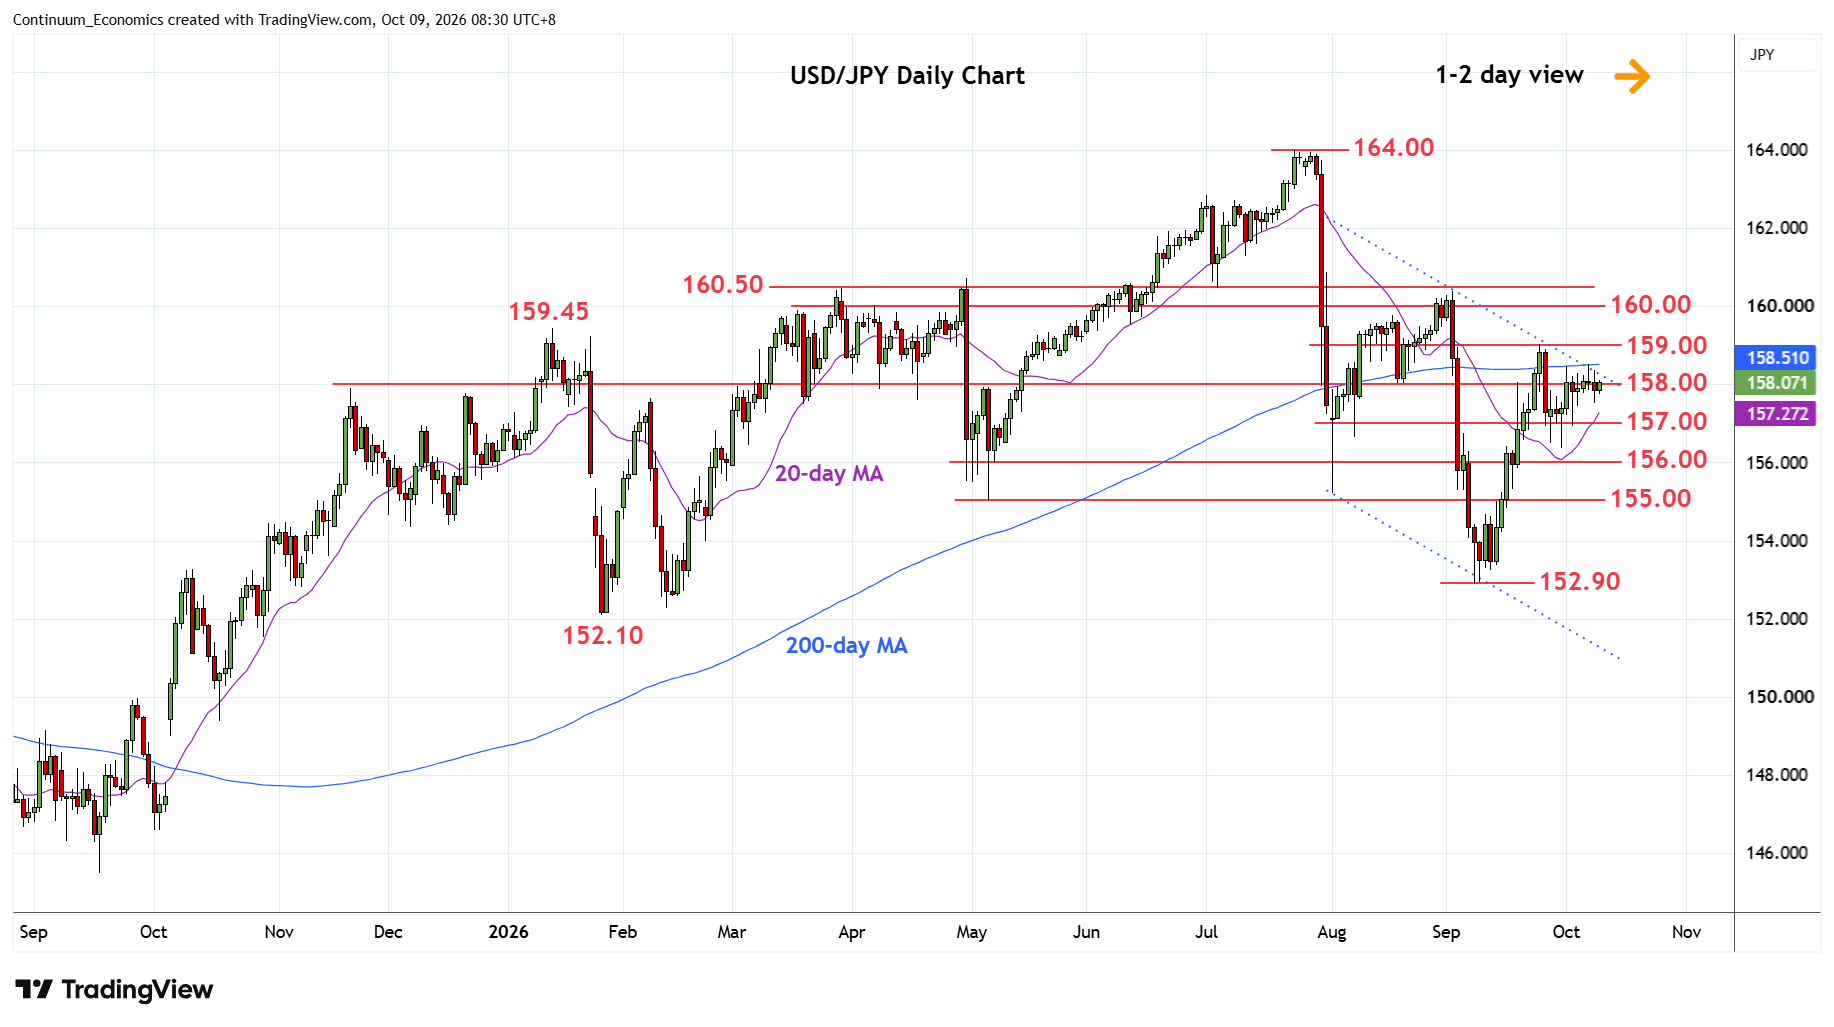
Little change, as prices trades sideways around the 158.00 level and below the 200-day MA
| Levels | Imp | Comment | Levels | Imp | Comment | |||
|---|---|---|---|---|---|---|---|---|
| R4 | 160.00 | ** | figure, congestion | S1 | 157.00 | * | congestion | |
| R3 | 159.75 | * | 61.8% Jul/Sep fall | S2 | 156.50/00 | * | congestion | |
| R2 | 159.00 | * | congestion | S3 | 155.00 | ** | May low, congestion | |
| R1 | 158.50 | * | 200-day MA | S4 | 154.00 | * | congestion |
Asterisk denotes strength of level
00:35 GMT - Little change, as prices trades sideways around the 158.00 level and below the 200-day MA. Would take break here expose the recent high at 159.00 to retest. Clearance here will further extend the September gains and see room to strong resistance at 159.75/160.00 area. Corrective gains are expected to give way to renewed selling pressure later with support starting at the 157.00 congestion. Below here will open up room for retest of support at the 156.50/156.00 congestion. Break here will return focus to the downside for retest of the 155.00 level, May low.