Chart USD Index DXY Update: Leaning lower in choppy trade
Consolidation around 102.20 has given way to a pullback in heightened volatility
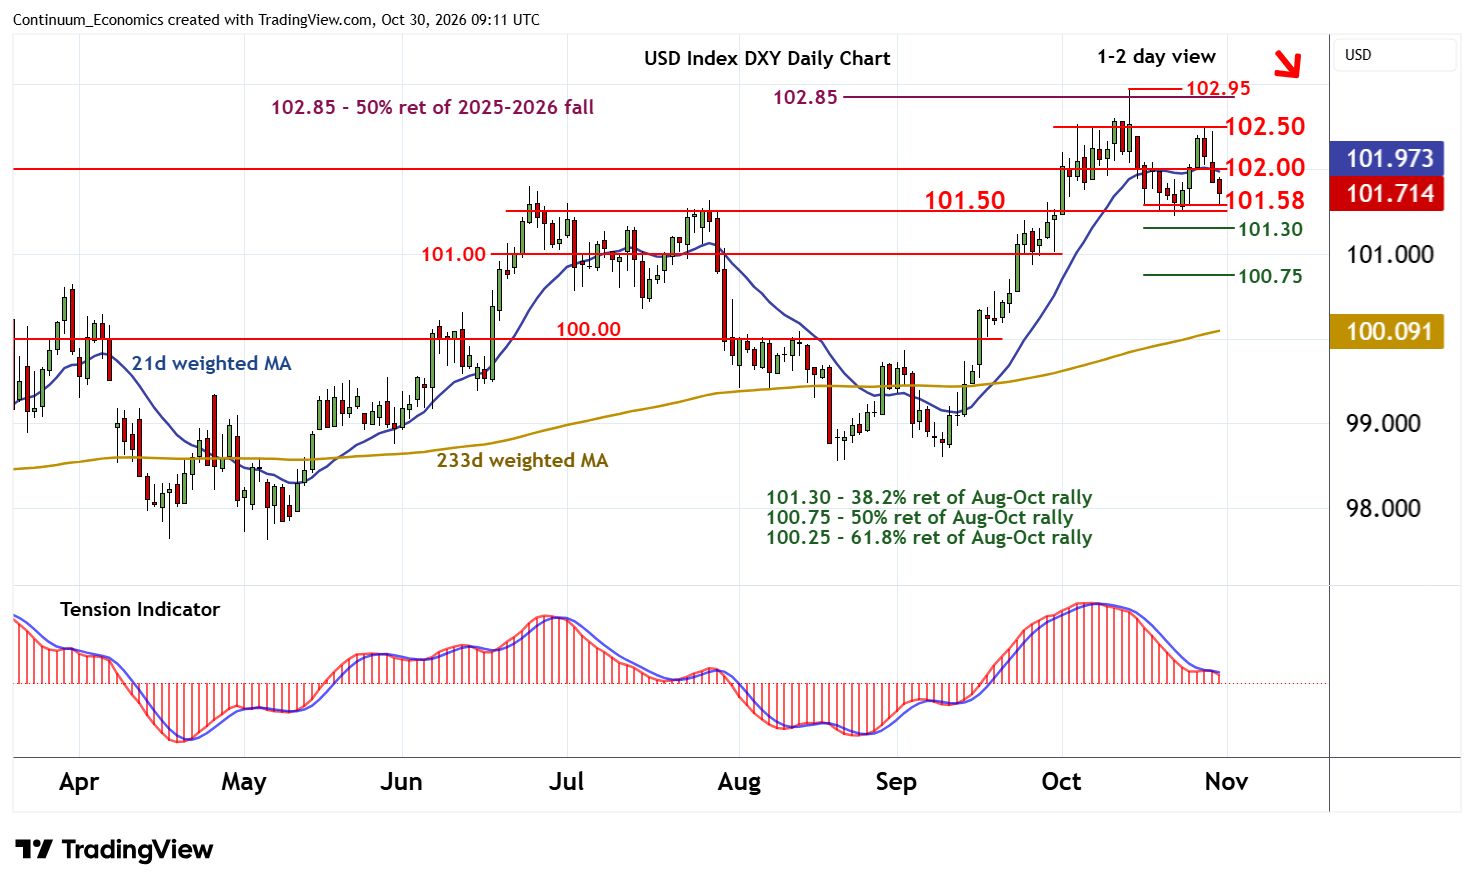
| Levels | Imp | Comment | Levels | Imp | Comment | |||
|---|---|---|---|---|---|---|---|---|
| R4 | 102.95/00 | ** | 14 Oct YTD high; congestion | S1 | 101.50/58 | * | range highs; 16 Oct (w) low | |
| R3 | 102.85 | ** | 50% ret of 2025-2026 fall | S2 | 101.30 | * | 38.2% ret of Aug-Oct rally | |
| R2 | 102.50 | congestion | S3 | 101.00 | ** | congestion | ||
| R1 | 102.00 | ** | congestion | S4 | 100.75 | * | 50% ret of Aug-Oct rally |
Asterisk denotes strength of level
08:55 GMT - Consolidation around 102.20 has given way to a pullback in heightened volatility, with prices reaching support at 101.50/58 before settling into choppy trade. Daily stochastics and the daily Tension Indicator have turned down, and overbought weekly stochastics are also unwinding, highlighting a deterioration in sentiment, pointing to room for further losses in the coming sessions. A close below 101.50/58 will add weight to sentiment and extend losses from the 102.95 current year high of 14 October towards the 101.30 Fibonacci retracement. A further break will open up congestion around 101.00, ahead of the 100.75 retracement.
Meanwhile, a close back above 102.00 would help to stabilise price action and prompt fresh consolidation beneath congestion around 102.50