Published: 2026-09-17T02:07:33.000Z
Chart GBP/USD Update: Under pressure
2
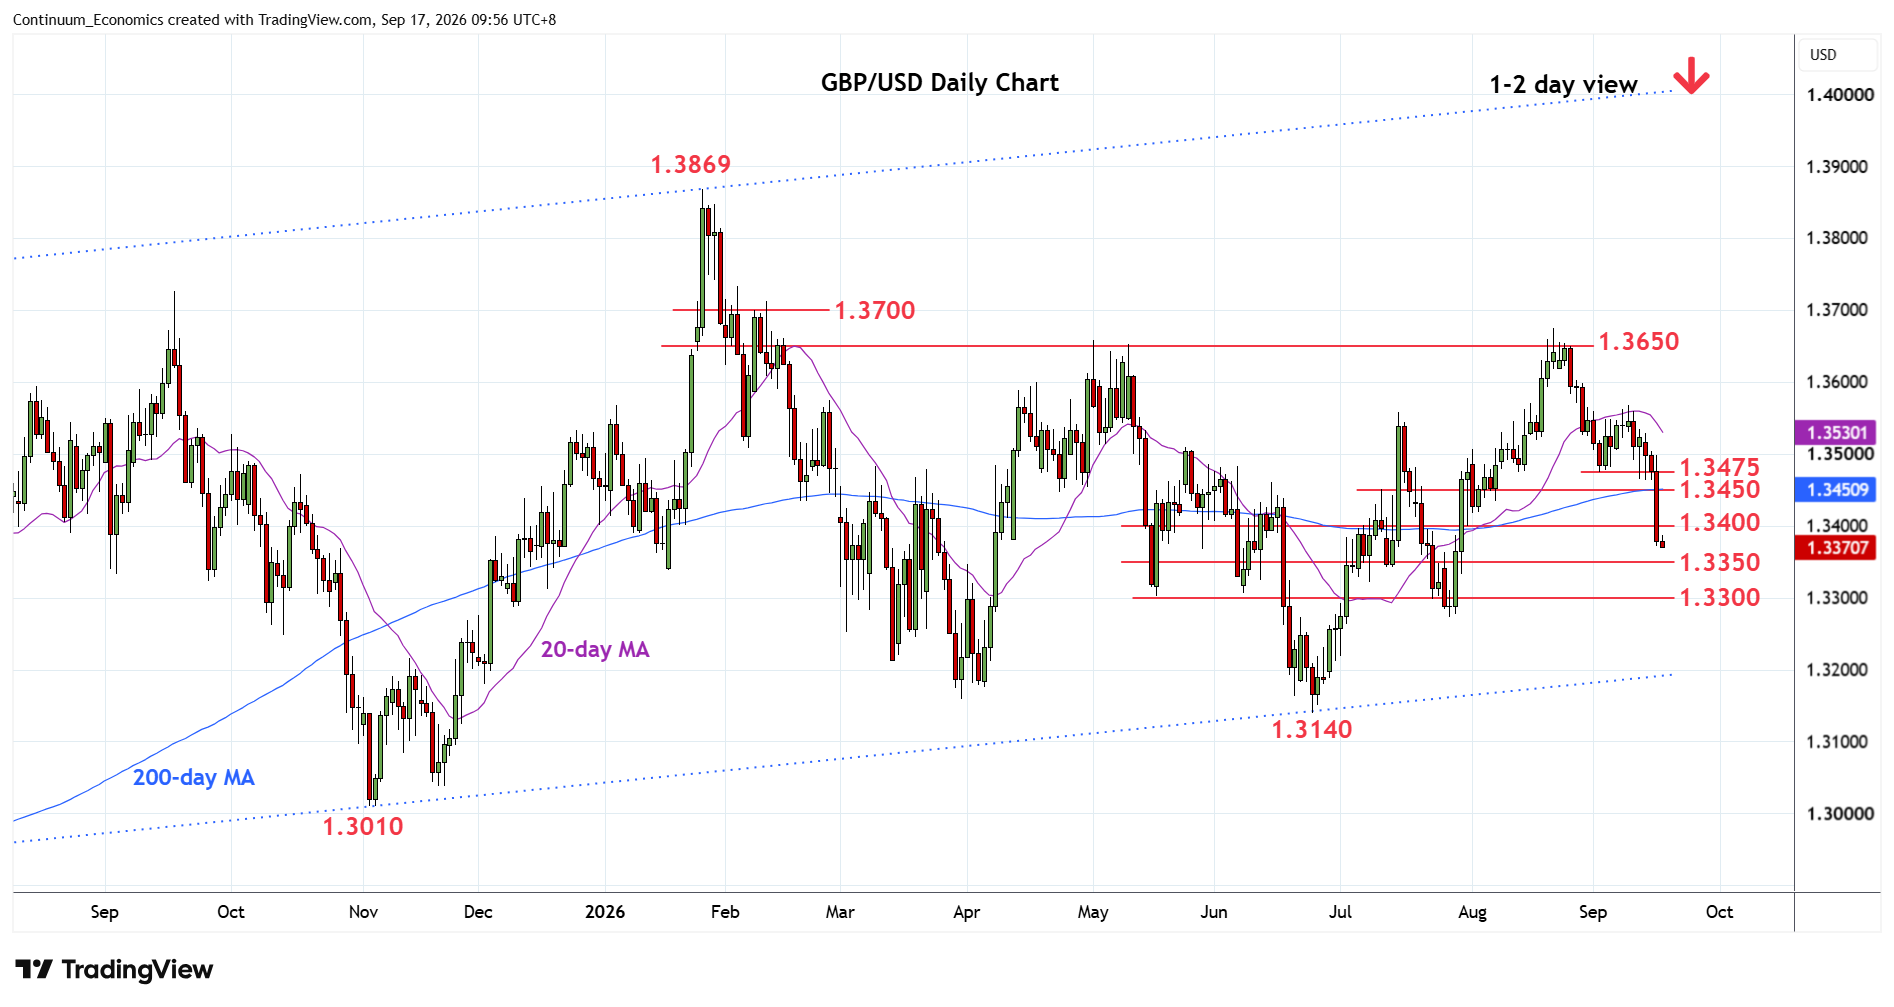
Under pressure, as prices extend sharp break of the 1.3475/1.3450 area to reach towards support at the 1.3350/45
| Level | Comment | Level | Comment | |||||
|---|---|---|---|---|---|---|---|---|
| R4 | 1.3500 | * | congestion | S1 | 1.3350/45 | * | congestion, 61.8% | |
| R3 | 1.3475 | ** | 2 Sep low | S2 | 1.3300 | ** | congestion | |
| R2 | 1.3450 | * | congestion | S3 | 1.3273 | * | 28 Jul low | |
| R1 | 1.3400 | * | congestion | S4 | 1.3250 | * | congestion |
Asterisk denotes strength of level
02:00 GMT - Under pressure, as prices extend sharp break of the 1.3475/1.3450 area to reach towards support at the 1.3350/45 congestion and 61.8% Fibonacci level. Negative daily and weekly studies keep pressure firmly on the downside and see room to further retrace the June/August gains. Lower still, will see room to strong support at the 1.3300/1.3273 congestion and late-July low. Meanwhile, resistance is lowered to the 1.3400 level. Would need to regain this to ease the downside pressure and open up room for retest of previous support turned resistance at 1.3450/75 area.