Published: 2026-07-31T11:47:37.000Z
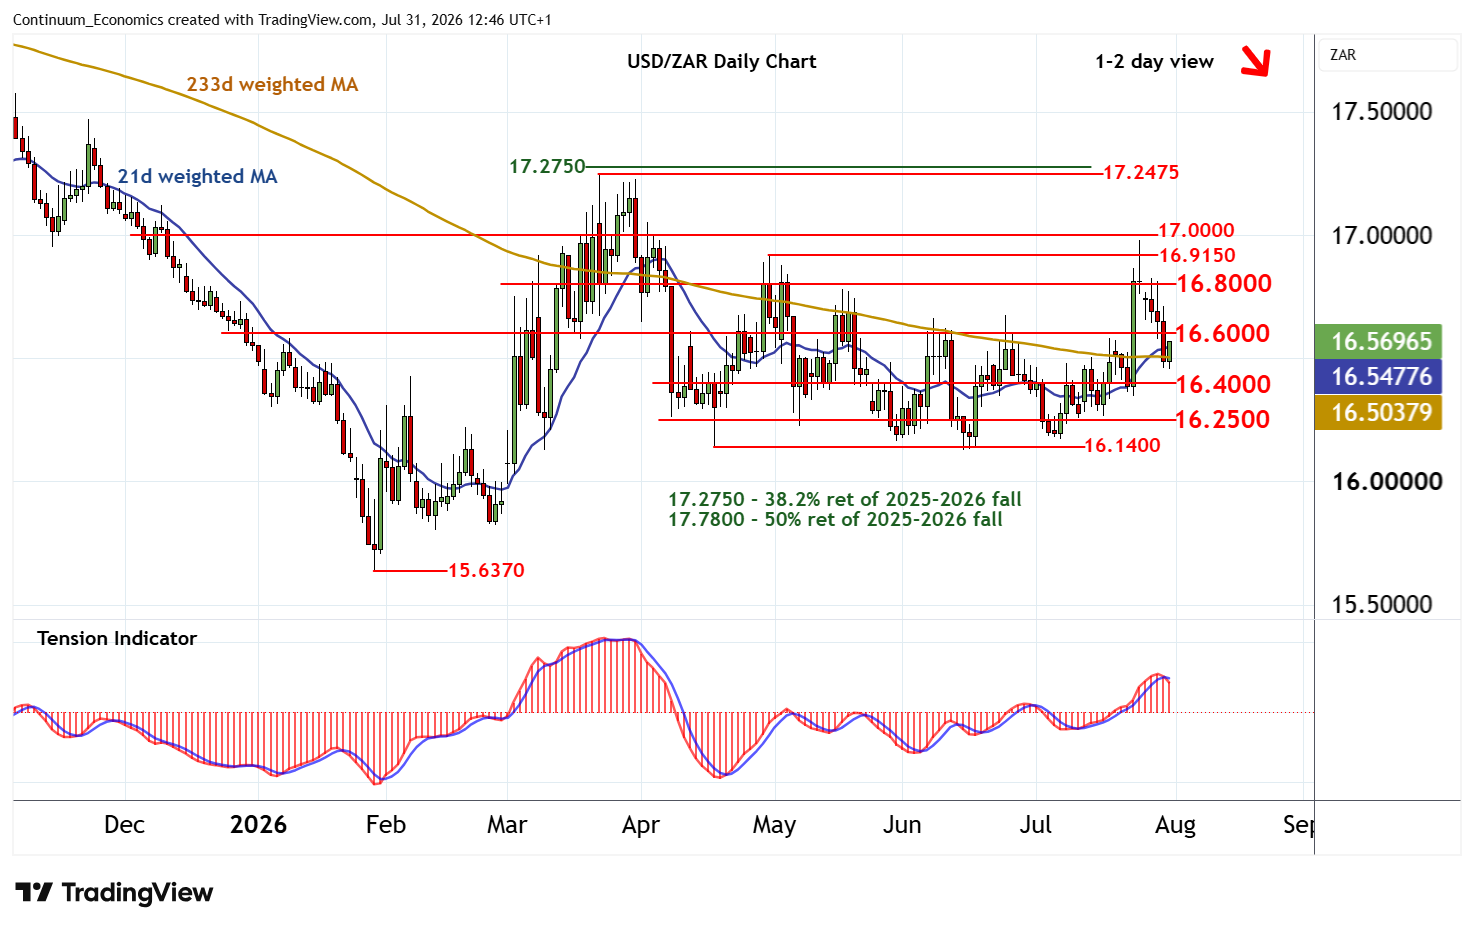
Chart USD/ZAR Update: Consolidating losses - daily studies under pressure
3
The anticipated break below 16.6000 has met buying interest above congestion support at 16.4000
| Level | Comment | Level | Comment | |||||
|---|---|---|---|---|---|---|---|---|
| R4 | 16.9785 | * | 24 Jul (w) high | S1 | 16.4000 | congestion | ||
| R3 | 16.9150 | ** | 30 Apr (w) high | S2 | 16.2500 | * | congestion | |
| R2 | 16.8000 | ** | congestion | S3 | 16.1400 | ** | 17 Apr (m) range low | |
| R1 | 16.6000 | * | congestion | S4 | 16.1000 | ** | congestion |
Asterisk denotes strength of level
12:15 BST - The anticipated break below 16.6000 has met buying interest above congestion support at 16.4000, as oversold intraday studies unwind. A minor bounce is developing, with focus turning back to 16.6000. But negative daily readings should limit any initial tests in renewed selling interest/consolidation. Following cautious/corrective trade, fresh losses are looked for. But positive weekly charts should limit any tests below 16.4000 in consolidation above further congestion around 16.2500. Meanwhile, a close back above 16.6000 would help to stabilise price action and prompt consolidation beneath 16.8000.