Published: 2026-09-01T01:00:47.000Z
Chart USD/JPY Update: Lower in range from 160.20 high
1
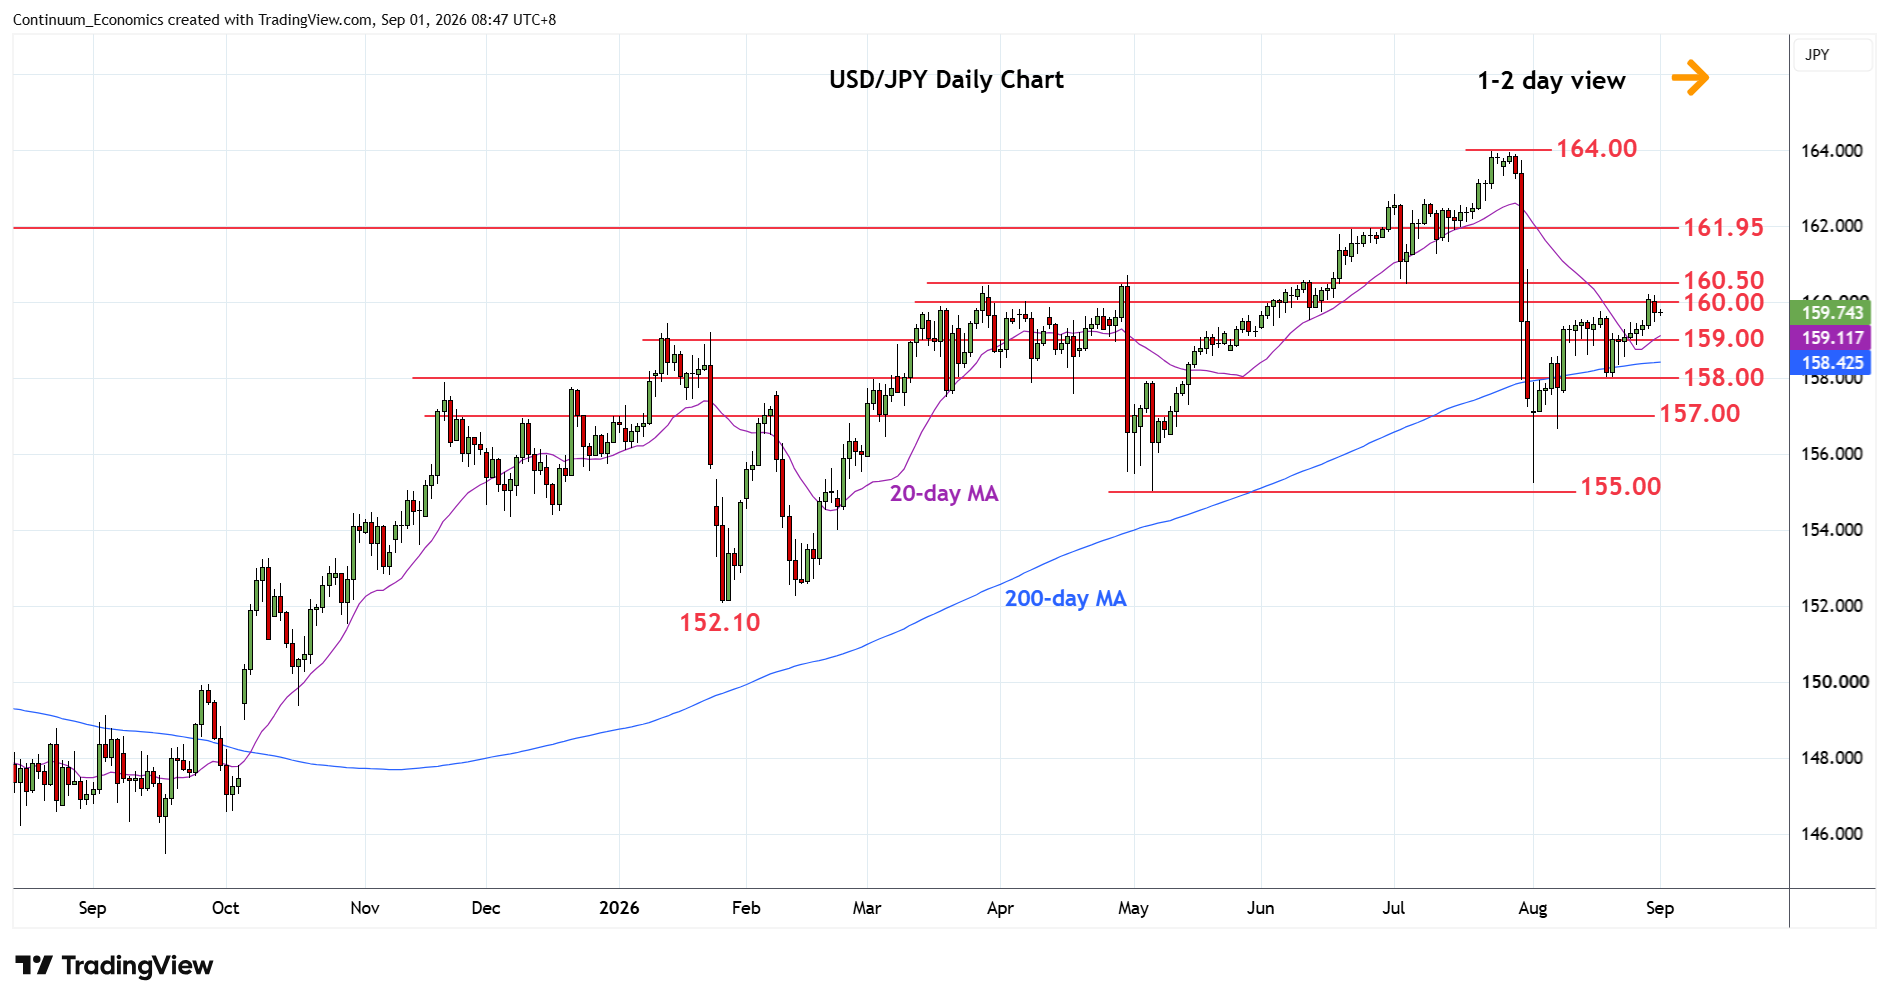
Settled back in range from the 160.20 August high as prices unwind overbought intraday studies and consolidate at the 159.50 congestion
| Levels | Imp | Comment | Levels | Imp | Comment | |||
|---|---|---|---|---|---|---|---|---|
| R4 | 161.95 | ** | Jul 2024 yr high | S1 | 159.50 | * | congestion | |
| R3 | 161.00/30 | * | congestion | S2 | 159.00 | * | congestion | |
| R2 | 160.50 | ** | congestion | S3 | 158.50/00 | ** | congestion | |
| R1 | 160.00/20 | ** | figure, 28 Aug high | S4 | 157.00 | ** | congestion |
Asterisk denotes strength of level
00:50 GMT - Settled back in range from the 160.20 August high as prices unwind overbought intraday studies and consolidate at the 159.50 congestion. Daily studies have turned flat and suggest scope for deeper pullback to the 159.00 level. Would take break here to fade the upside pressure and see room for deeper pullback to strong support at the 158.50/158.00 congestion area. Meanwhile, resistance at the 160.00/160.20 area and extending to the 160.50 congestion expected to cap gains. Break, if seen, will open up room towards the 161.00/30 area and 161.95, 2024 year high.