Chart EUR/USD Update: Sharp pullback from resistance
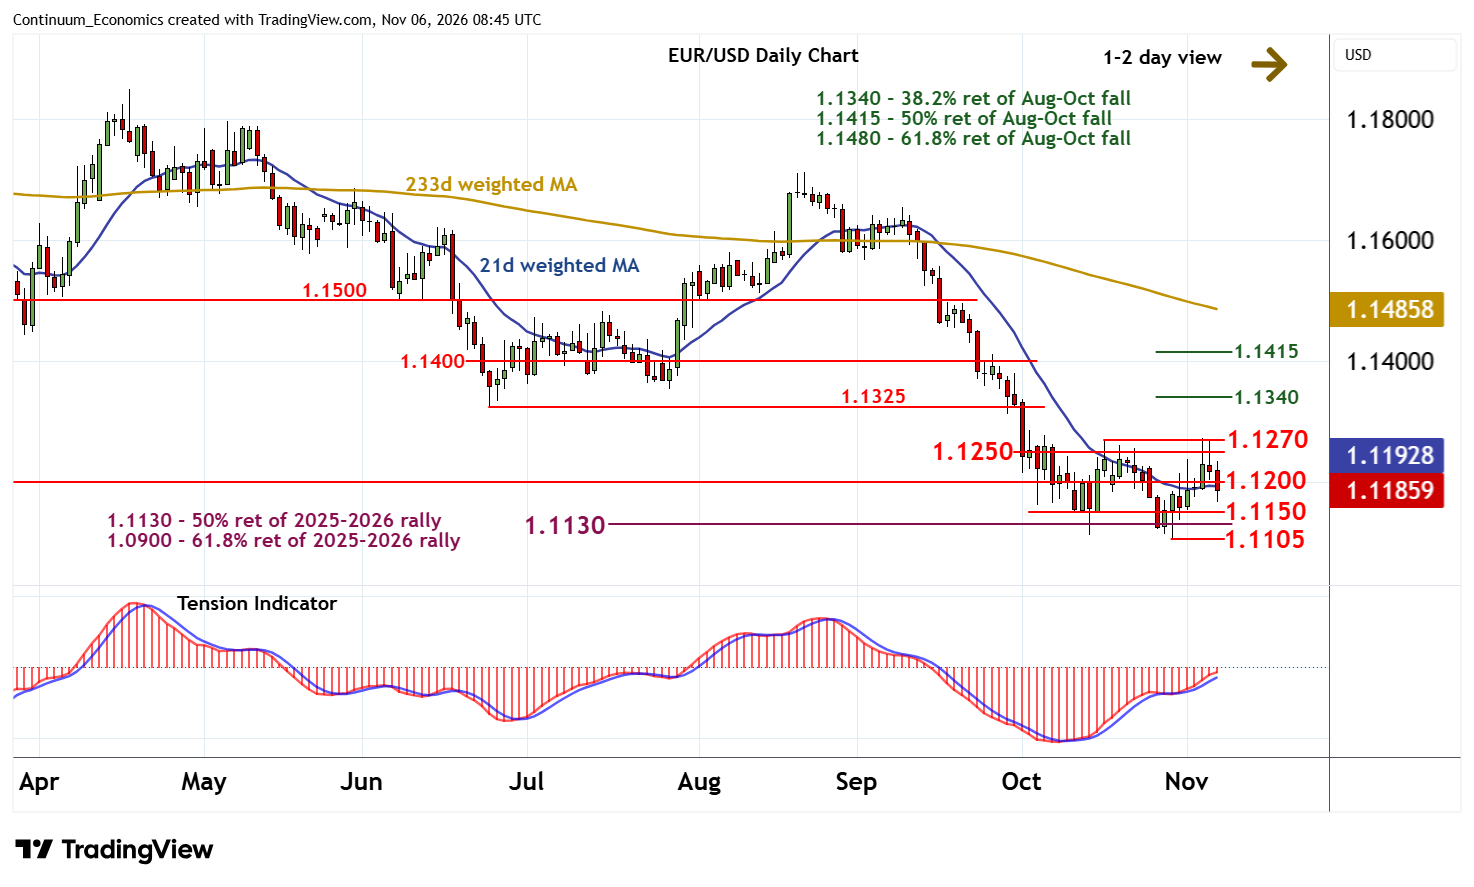
Choppy trade within resistance at congestion around 1.1250 and the 1.1270 weekly high of 16 October has given way to a steady pullback
| Levels | Imp | Comment | Levels | Imp | Comment | |||
|---|---|---|---|---|---|---|---|---|
| R4 | 1.1325/40 | ** | 24 Jun (m) low; 38.2% ret | S1 | 1.1150 | congestion | ||
| R3 | 1.1270 | ** | 16 Oct (w) high | S2 | 1.1130 | ** | 50% ret of 2025-2026 rally | |
| R2 | 1.1250 | congestion tops | S3 | 1.1100/05 | ** | congestion; 29 Oct YTD low | ||
| R1 | 1.1200 | ** | break level | S4 | 1.11.1065 | ** | 12 May 2025 (m) low |
*Asterisk denotes strength of level
08:30 GMT - Choppy trade within resistance at congestion around 1.1250 and the 1.1270 weekly high of 16 October has given way to a steady pullback, with prices breaking below 1.1200 to currently trade around 1.1185. Overbought daily stochastics are turning down, highlighting room for continuation towards congestion support at 1.1150. But the positive daily Tension Indicator and mixed weekly charts should prompt fresh consolidation/range extension above here. A close below 1.1150, however, will add weight to sentiment and open up a test of critical support down to the 1.1105 current year low of 29 October.
Meanwhile, a close above 1.1200 would help to stabilise price action and prompt fresh consolidation beneath the 1.1250 - 1.1270 range.