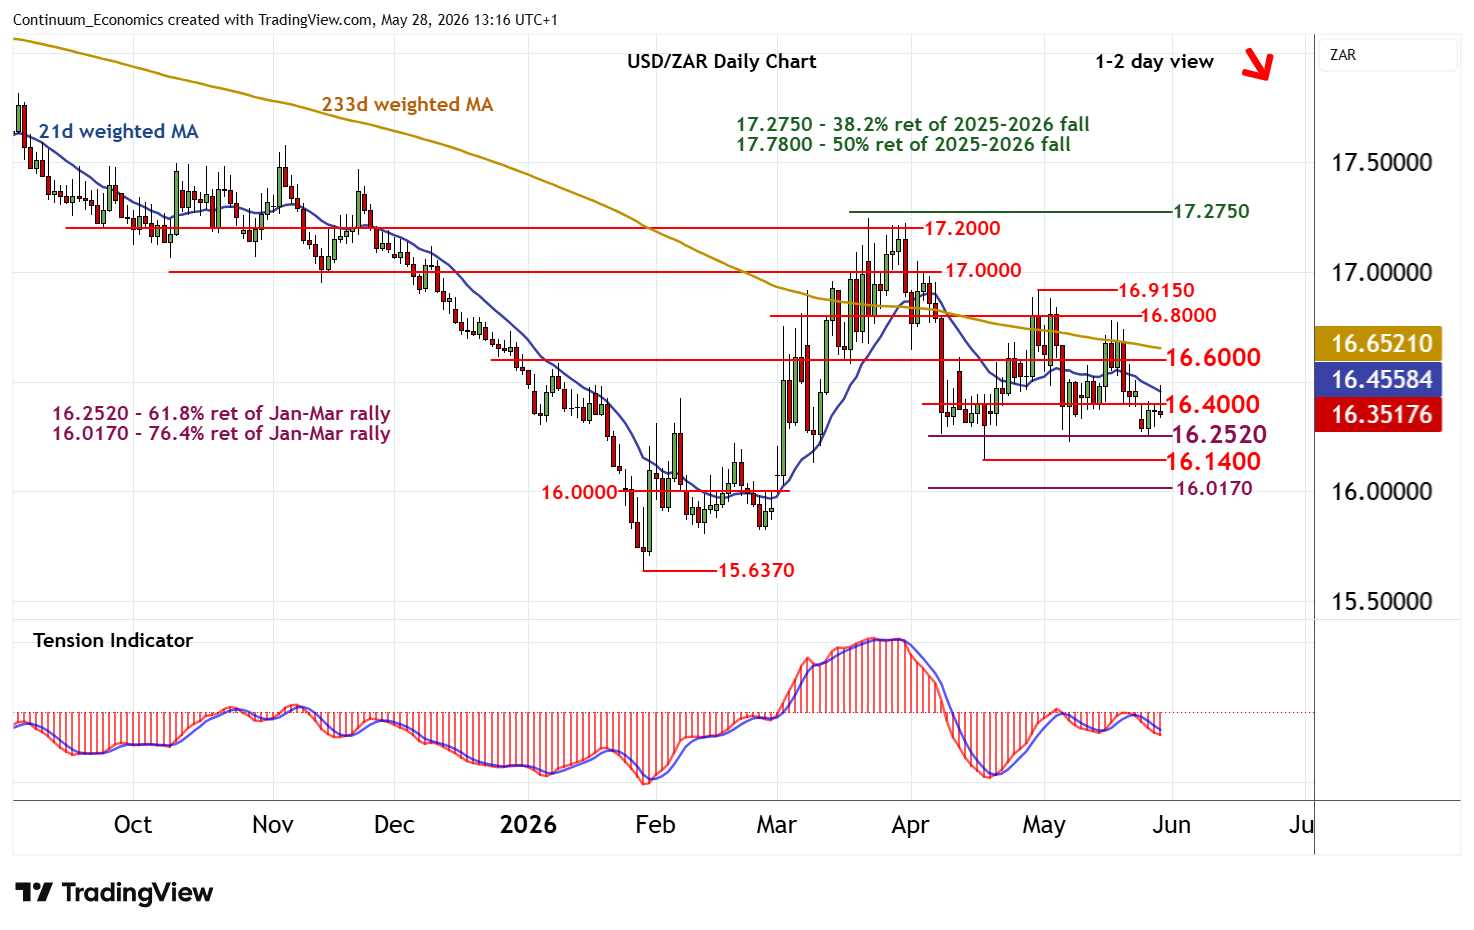
Chart USD/ZAR Update: Higher levels not sustained
Cautious trade has given way to a test above congestion resistance at 16.4000
| Level | Comment | Level | Comment | |||||
|---|---|---|---|---|---|---|---|---|
| R4 | 16.9150 | ** | 30 Apr (w) high | S1 | 16.2520 | ** | 61.8% ret of Jan-Mar rally | |
| R3 | 16.8000 | * | congestion | S2 | 16.1400 | ** | 17 Apr (m) low | |
| R2 | 16.6000 | * | congestion | S3 | 16.0170 | ** | 76.4% ret of Jan-Mar rally | |
| R1 | 16.4000 | congestion | S4 | 16.0000 | ** | congestion |
Asterisk denotes strength of level
12:45 BST - Cautious trade has given way to a test above congestion resistance at 16.4000, before falling sharply back into range. Oversold daily stochastics are unwinding, highlighting potential for further consolidation, before the bearish daily Tension Indicator and mixed/negative weekly charts prompt further losses. Support remains at the 16.2520 Fibonacci retracement. However, a close below the 16.1400 monthly low of 17 April is needed to turn sentiment negative and extend late-March losses towards the 16.0170 retracement. Meanwhile, a close above 16.4000 would help to stabilise price action and give way to consolidation beneath further congestion around 16.6000.