Chart USD/ZAR Update: Deeper pullback
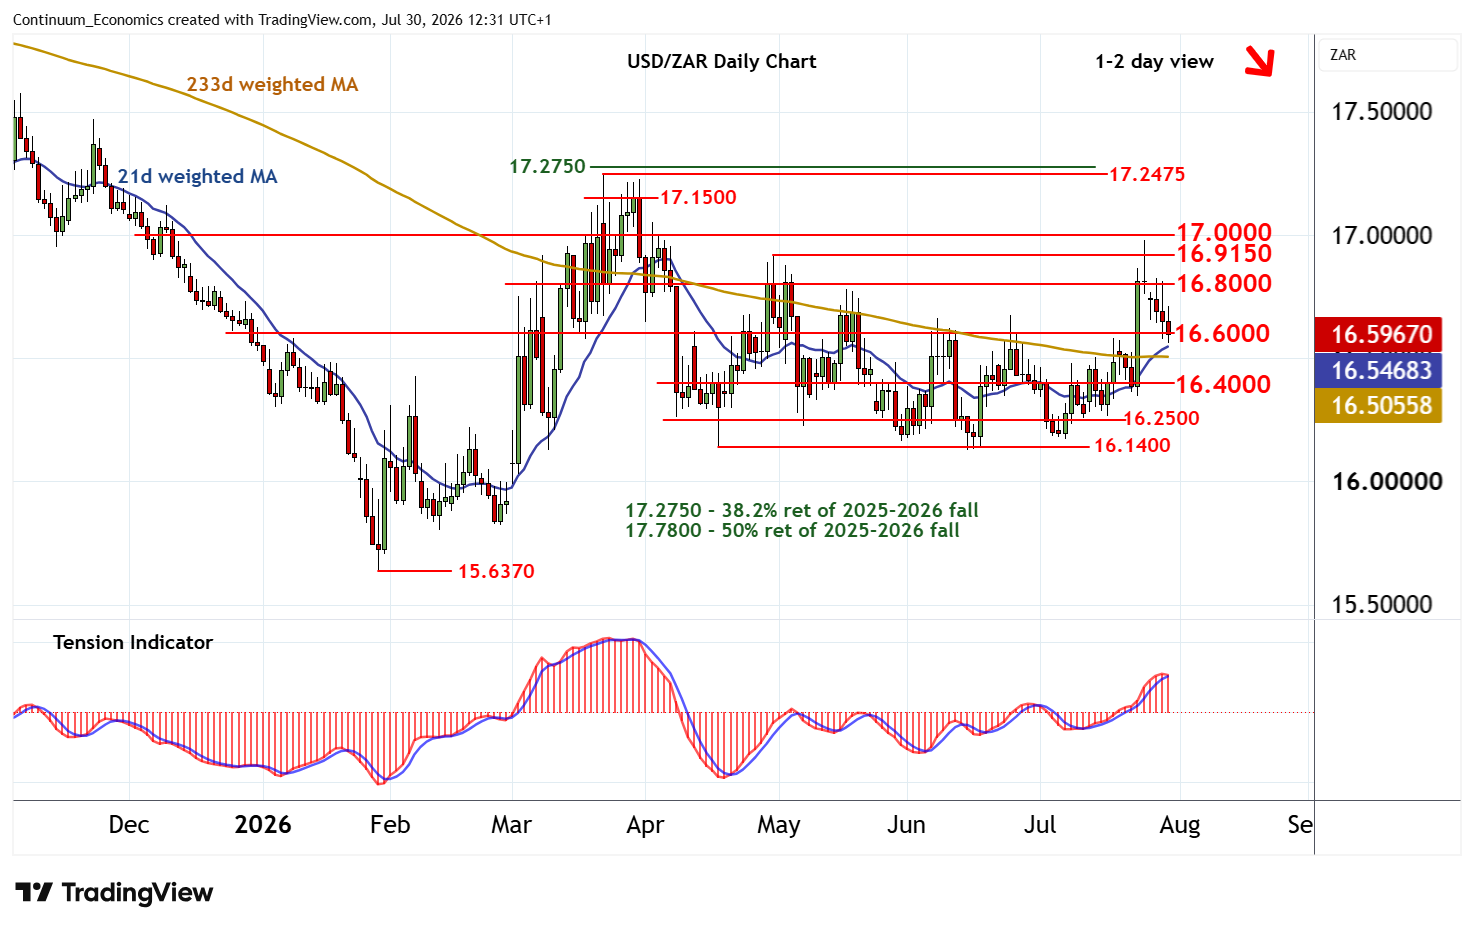
Cautious trade has given way to the anticipated pullback
| Level | Comment | Level | Comment | |||||
|---|---|---|---|---|---|---|---|---|
| R4 | 17.0000 | * | congestion | S1 | 16.6000 | * | congestion | |
| R3 | 16.9785 | * | 24 Jul (w) high | S2 | 16.4000 | congestion | ||
| R2 | 16.9150 | ** | 30 Apr (w) high | S3 | 16.2500 | * | congestion | |
| R1 | 16.8000 | ** | congestion | S4 | 16.1400 | ** | 17 Apr (m) range low |
Asterisk denotes strength of level
12:10 BST - Cautious trade has given way to the anticipated pullback, with prices currently pressuring congestion support at 16.6000. Daily stochastics are under pressure and the daily Tension Indicator is turning down, highlighting a deterioration in sentiment and room for a deeper retracement. A break beneath here will open up further congestion around 16.4000. But positive weekly charts should limit any tests in renewed consolidation/buying interest. Following cautious/corrective trade, fresh gains are looked for. However, a close above the 16.9150 weekly high of 30 April is needed to improve sentiment and extend mid-April gains towards congestion around 17.0000.