Published: 2026-08-13T00:44:30.000Z
Chart NZD/USD Update: Leaning lower in choppy trade
2
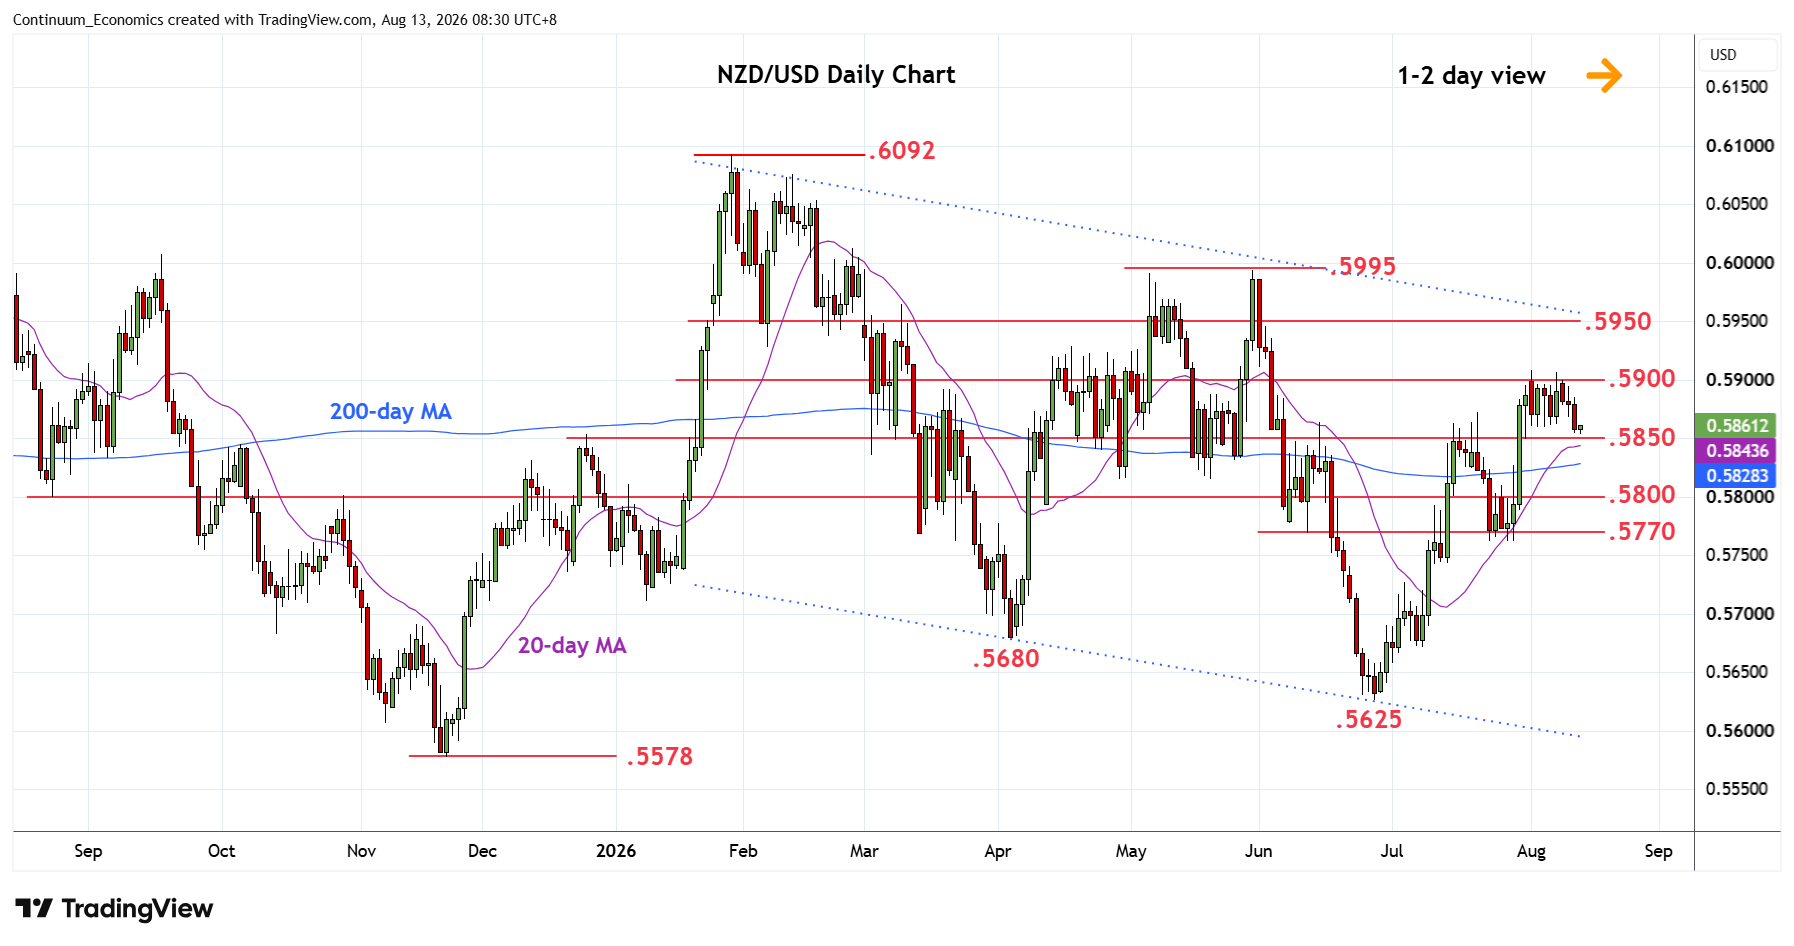
Sideways ranging action see prices leaning lower from the .5900/08 high of last week
| Levels | Imp | Comment | Levels | Imp | Comment | |||
|---|---|---|---|---|---|---|---|---|
| R4 | .6000/13 | * | congestion, 26 Feb high | S1 | .5850 | * | congestion | |
| R3 | .5995 | ** | May high | S2 | .5815/00 | * | May low, congestion | |
| R2 | .5950 | * | congestion | S3 | .5770/62 | ** | congestion, 23 Jul low | |
| R1 | .5900 | * | congestion | S4 | .5750 | * | congestion |
Asterisk denotes strength of level
00:35 GMT - Sideways ranging action see prices leaning lower from the .5900/08 high of last week. Daily studies have turned down from overbought areas and threatens break of the .5850 support to open up room for deeper corrective pullback to the .5815/.5800, May low and congestion area. Meanwhile, resistance remains at the .5900/08 area. Would take break here to extend gains from the .5625 June current year low towards resistance at .5930/50 congestion area. Break here will see potential for retest of the .5995, May high.