Published: 2026-06-30T00:39:45.000Z
Chart NZD/USD Update: Shallow bounce from .5625 current year low
1
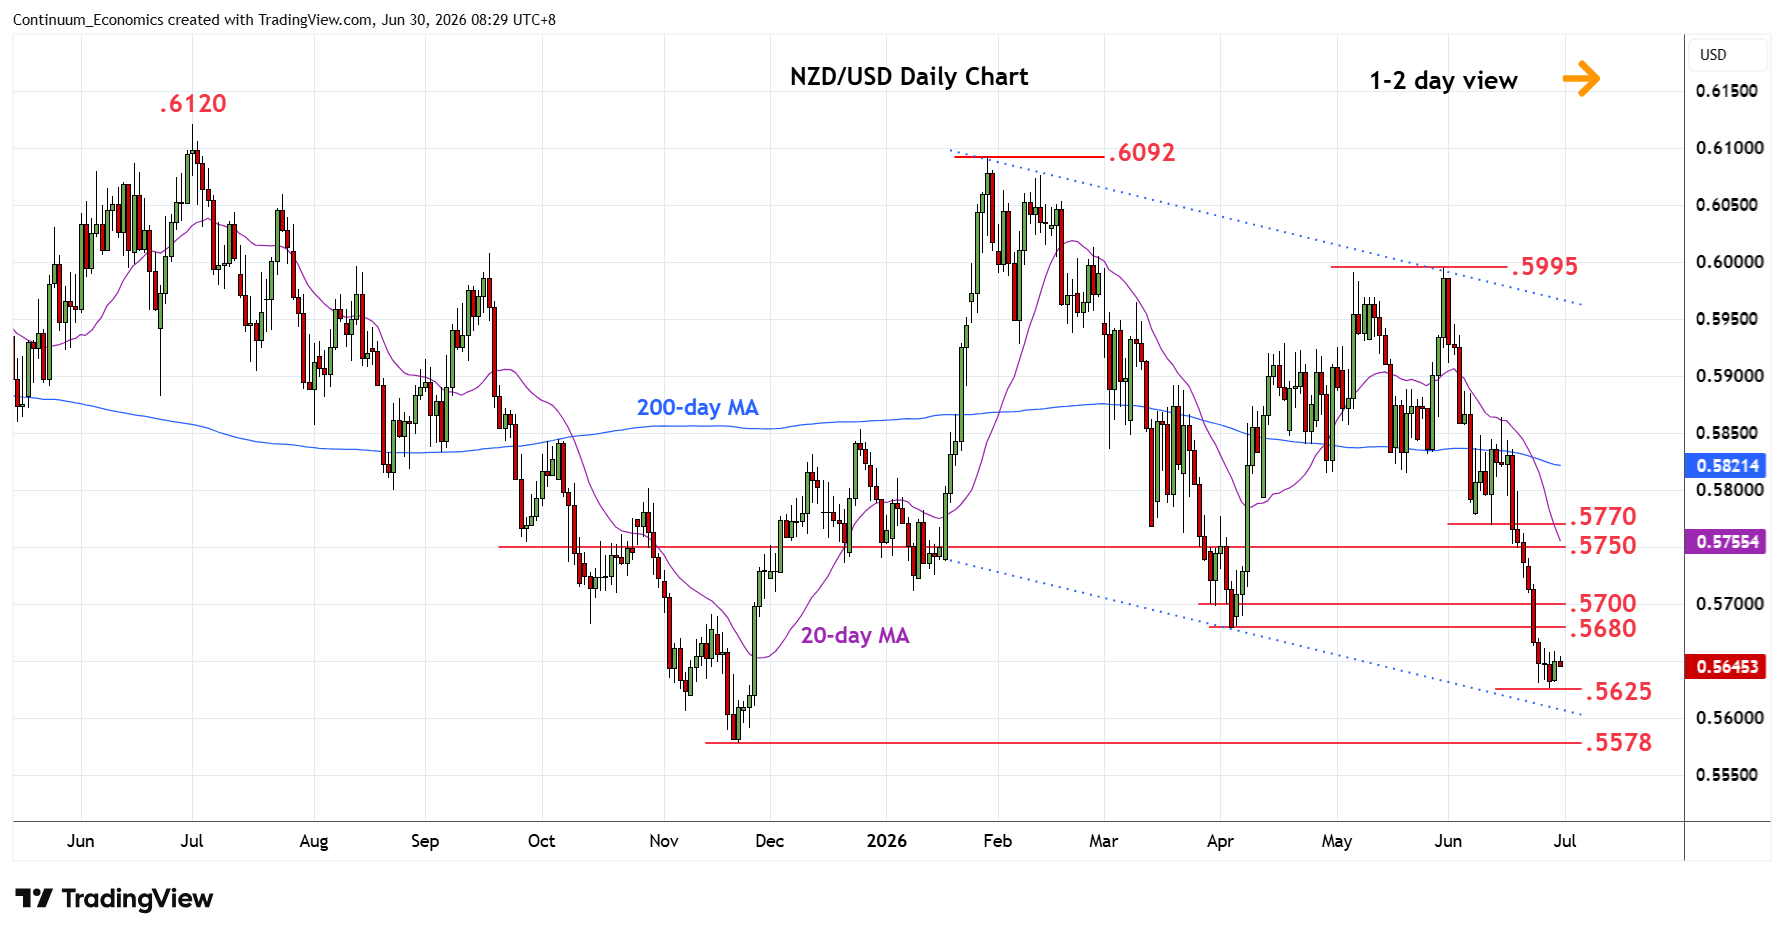
Turned up in range from the .5625 low as prices consolidate sharp losses from the mid-June high
| Levels | Imp | Comment | Levels | Imp | Comment | |||
|---|---|---|---|---|---|---|---|---|
| R4 | .5750 | * | congestion | S1 | .5625 | * | 26 Jun YTD low | |
| R3 | .5700 | * | congestion | S2 | .5610/00 | * | channel, congestion | |
| R2 | .5680 | ** | Apr low | S3 | .5578 | ** | Nov low | |
| R1 | .5650 | * | congestion | S4 | .5550 | congestion |
Asterisk denotes strength of level
00:30 GMT - Turned up in range from the .5625 low as prices consolidate sharp losses from the mid-June high and unwind oversold daily studies. However, shallow bounce threatens further losses and lower will see scope to the nearby lower channel from the January high at .5610. Below this will see room to the .5578 November low. Meanwhile, resistance remains at the .5650 congestion and this extend to the .5680/.5700 April low and congestion area. Would need to regain these to ease the downside pressure and sets up room for stronger bounce towards .5750/70.