Published: 2026-09-21T00:26:53.000Z
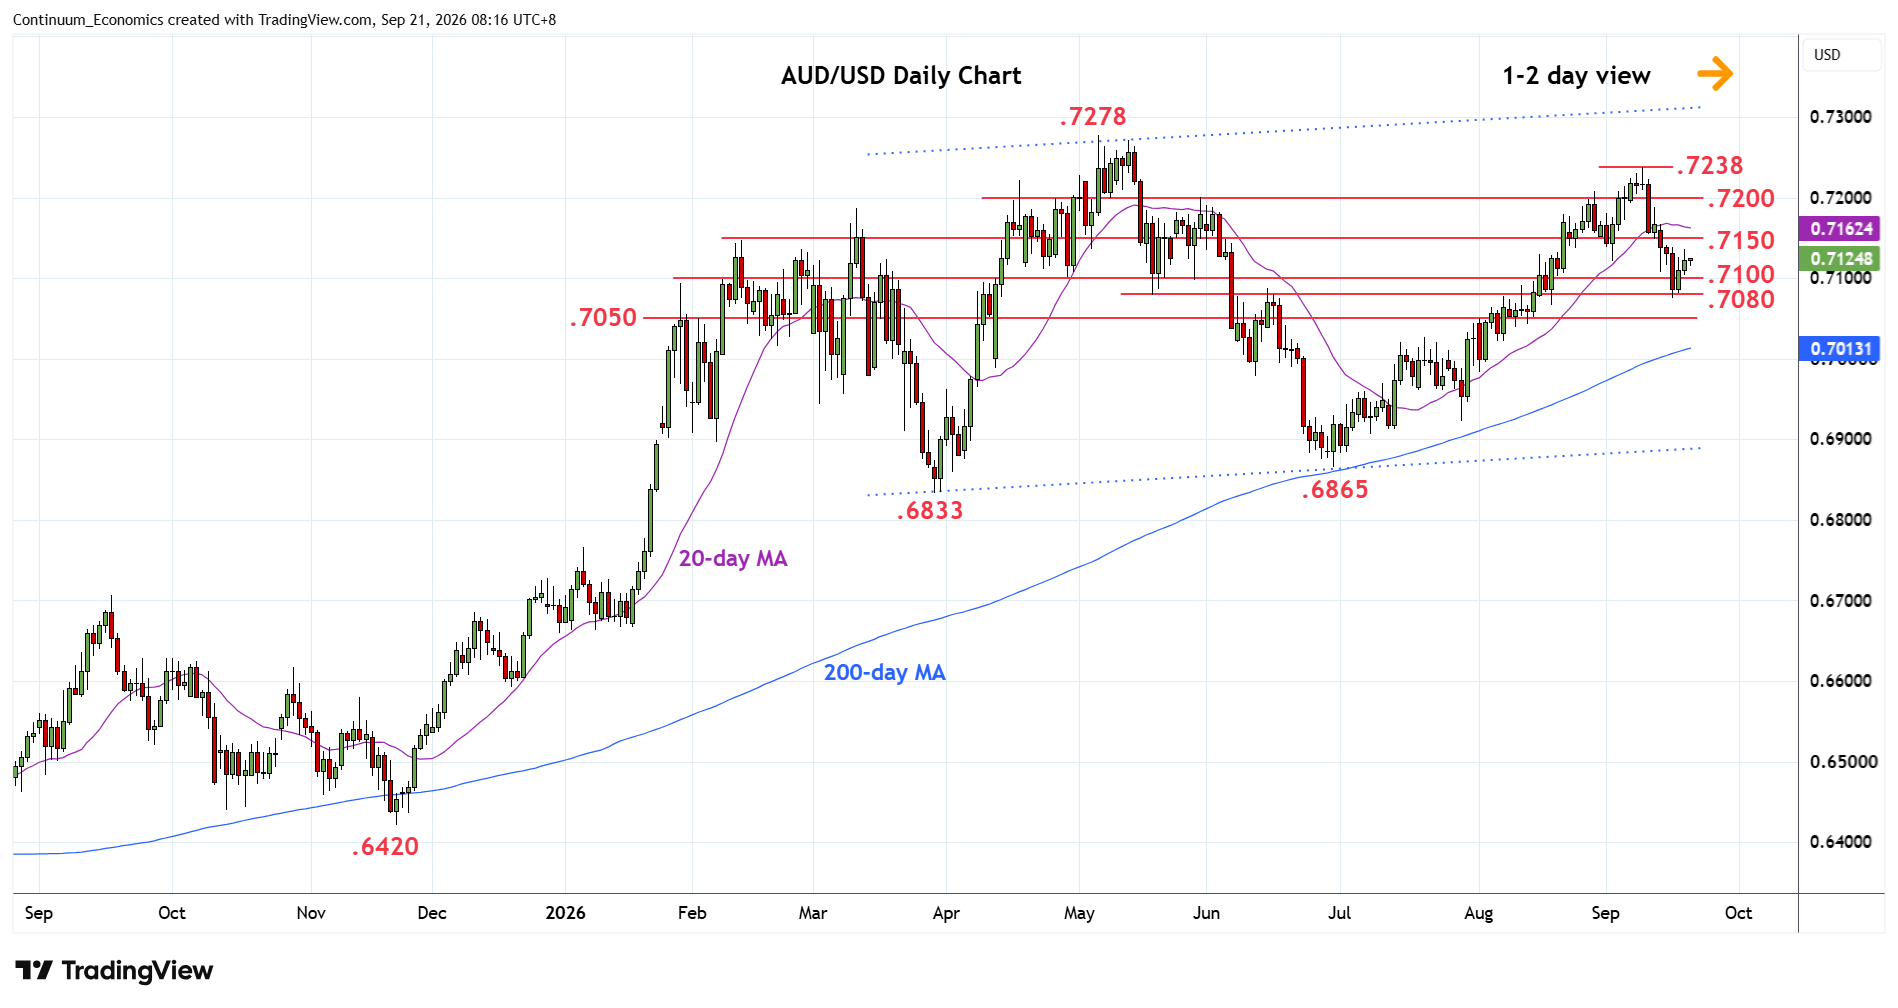
Chart AUD/USD Update: Higher in consolidation from .7100/.7080 support
2
Turned up from the .7100/.7080 support as prices consolidate losses from the .7238 high of 9 September
| Levels | Imp | Comment | Levels | Imp | Comment | |||
|---|---|---|---|---|---|---|---|---|
| R4 | 0.7278 | ** | 6 May YTD high | S1 | 0.7100 | * | congestion | |
| R3 | 0.7238 | ** | 9 Sep high | S2 | 0.7080 | * | May low | |
| R2 | 0.7200 | * | congestion | S3 | 0.7050 | ** | congestion, 50% | |
| R1 | 0.7150 | * | congestion | S4 | 0.7005/00 | ** | 61.8%, congestion |
Asterisk denotes strength of level
00:20 GMT - Turned up from the .7100/.7080 support as prices consolidate losses from the .7238 high of 9 September and unwind oversold intraday studies. Daily studies have stretched as well and suggest scope for bounce to resistance at .7150. Would take here to ease the downside pressure and open up room for retest of resistance at .7180/.7200 area. Above these will return focus to the .7238 and .7378 highs. Meanwhile, support at the .7100/.7080 area now underpin. Would take break here to see deeper pullback to retrace the June/September rally towards the .7050 ccongestion and 50% Fibonacci level.