Monthly US Chart 10 Year Yield: Further losses to give way to consolidation
The anticipated pullback from the 19-year high at 5.365% of 7 October has broken below 5.000% to reach 4.814%
The anticipated pullback from the 19-year high at 5.365% of 7 October has broken below 5.000% to reach 4.814%.
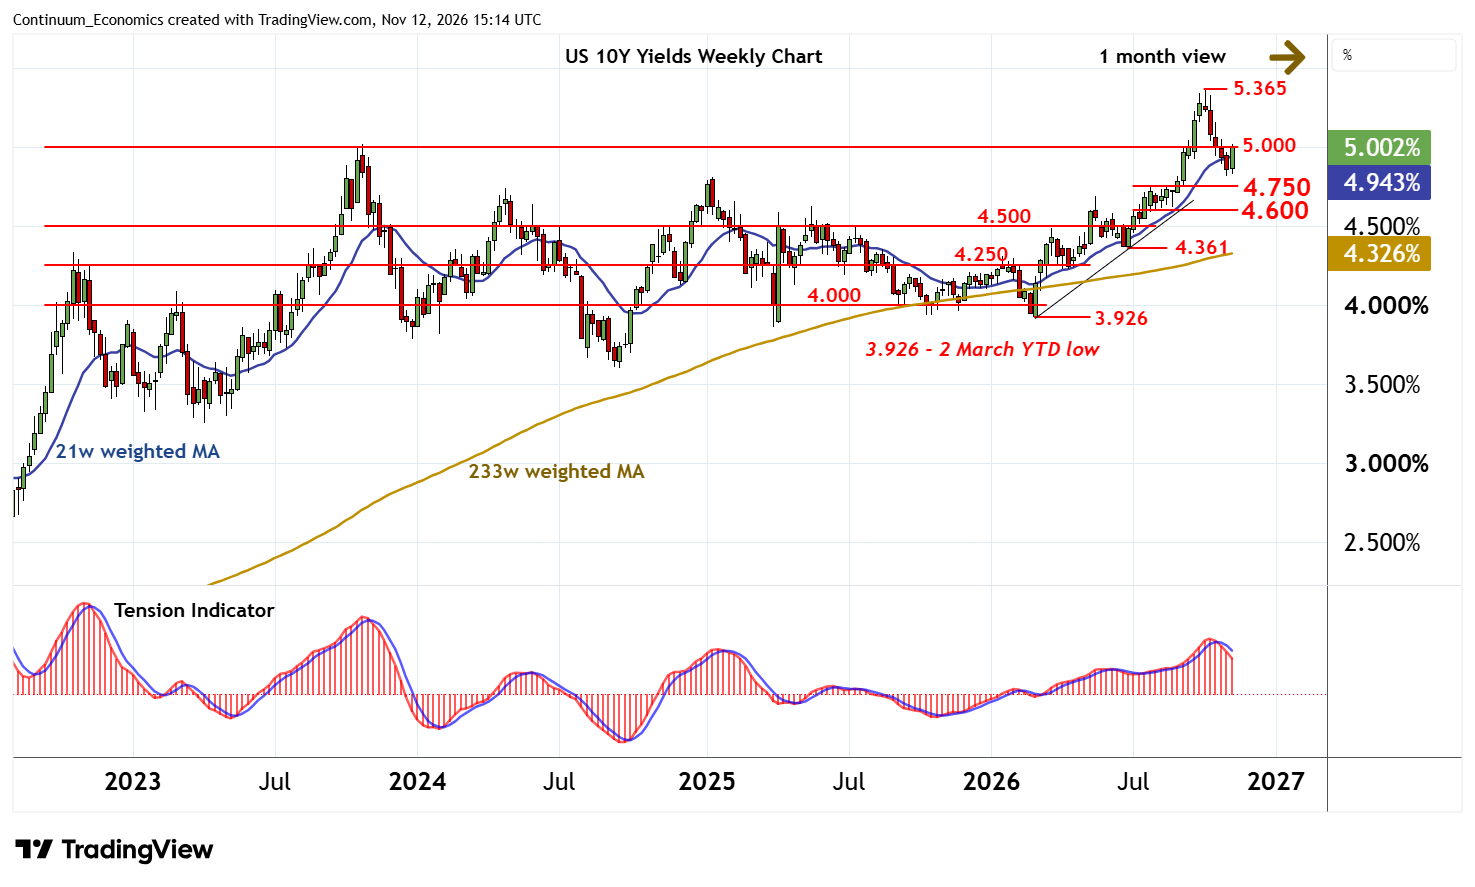
A corrective bounce is appearing from here, as daily readings turn higher, with yields currently trading back at 5.000%.
Weekly stochastics are flattening in oversold areas, suggesting room for cautious trade into the coming week(s), before the bearish weekly Tension Indicator prompts fresh losses towards support at the 4.750% range highs from July-August. Unwinding overbought monthly stochastics highlight potential for continuation down to the 4.600% range lows. But the positive monthly Tension Indicator and improving longer-term charts should limit any tests of this 4.600% - 4.750% range in consolidation.
Meanwhile, resistance is lowered to 5.000%.
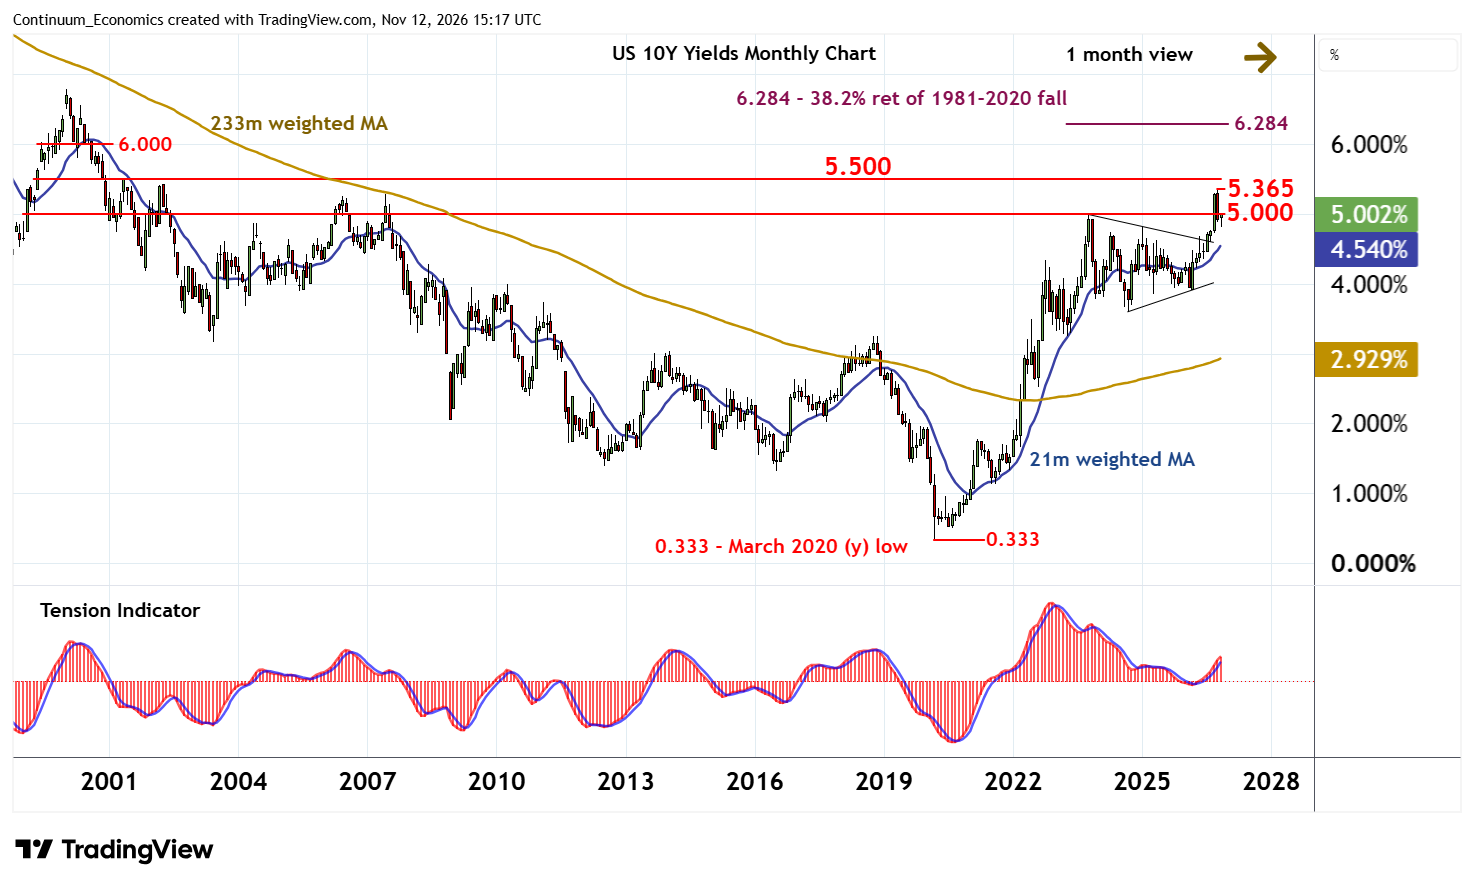
A later close above here will provide further price stability. But a close above 5.365% is needed, not yet seen, to improve sentiment and confirm continuation of the broad March 2020 bull trend.