Published: 2026-06-01T12:22:52.000Z
Chart USD/ZAR Update: Limited tests higher - studies under pressure
1
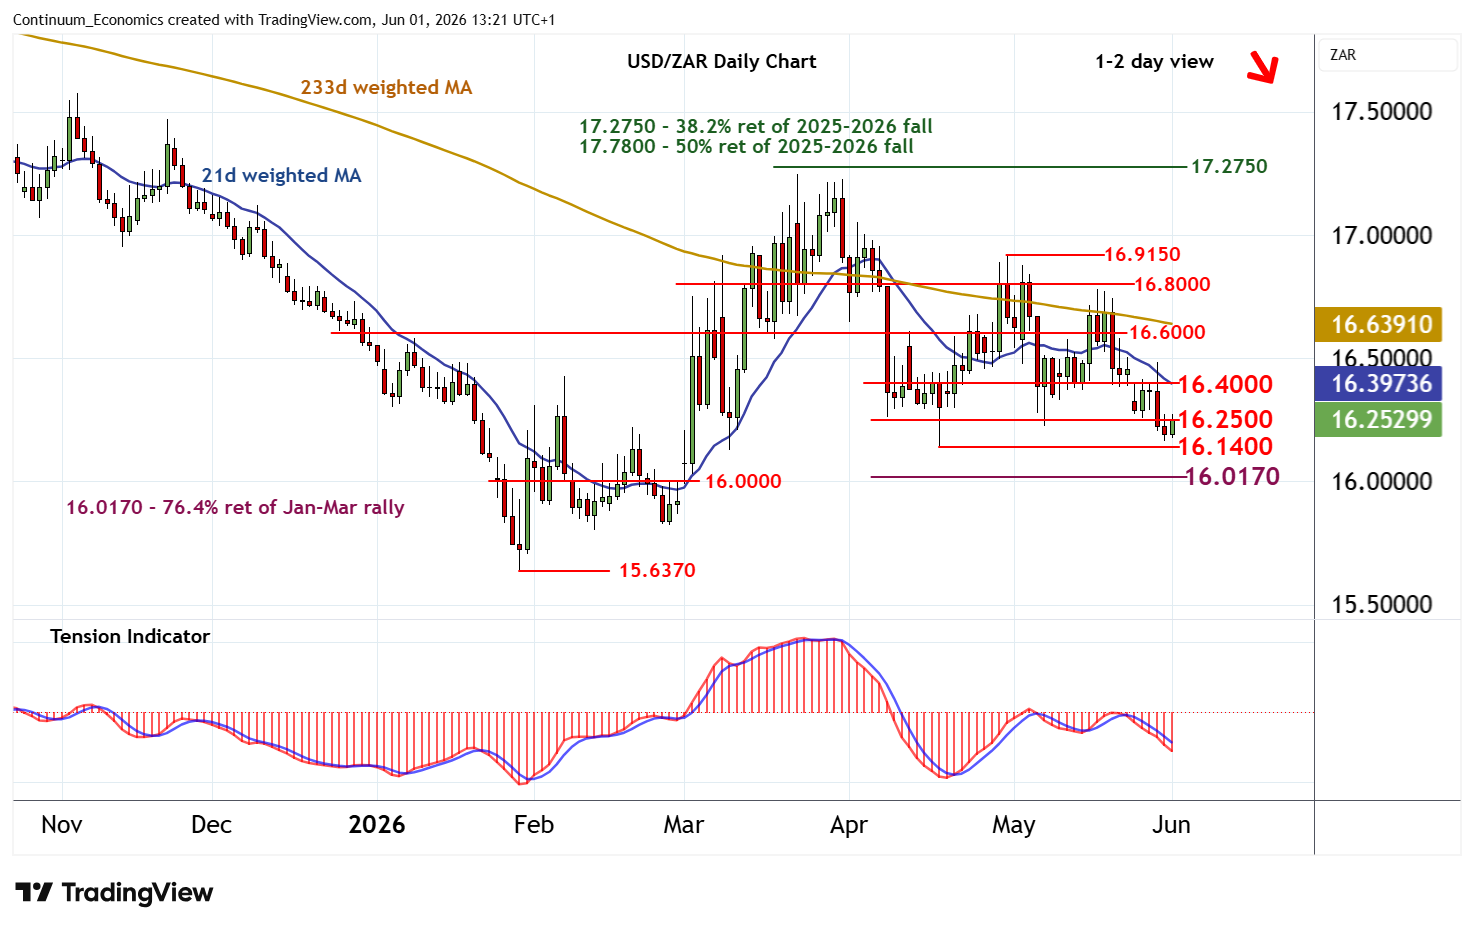
Cautious trade is giving way to a test higher
| Level | Comment | Level | Comment | |||||
|---|---|---|---|---|---|---|---|---|
| R4 | 16.8000 | * | congestion | S1 | 16.1400 | ** | 17 Apr (m) low | |
| R3 | 16.6000 | * | congestion | S2 | 16.0170 | ** | 76.4% ret of Jan-Mar rally | |
| R2 | 16.4000 | congestion | S3 | 16.0000 | ** | congestion | ||
| R1 | 16.2500 | * | congestion | S4 | 15.8215 | ** | 26 Feb (w) low |
Asterisk denotes strength of level
13:05 BST - Cautious trade is giving way to a test higher, as oversold intraday studies unwind, with prices currently pressuring congestion resistance at 16.2500. A test above here cannot be ruled out. But negative daily readings and bearish weekly charts should limit scope in renewed selling interest beneath further congestion around 16.4000. Following cautious/corrective trade, fresh losses are looked for. A later close below the 16.1400 monthly low of 17 April will add weight to sentiment and extend late-March losses towards the 16.0170 retracement.