Chart AUD/USD Update: Limited tests higher
Consolidation above 0.6900 has given way to a test above the 0.6925 high of 25 June
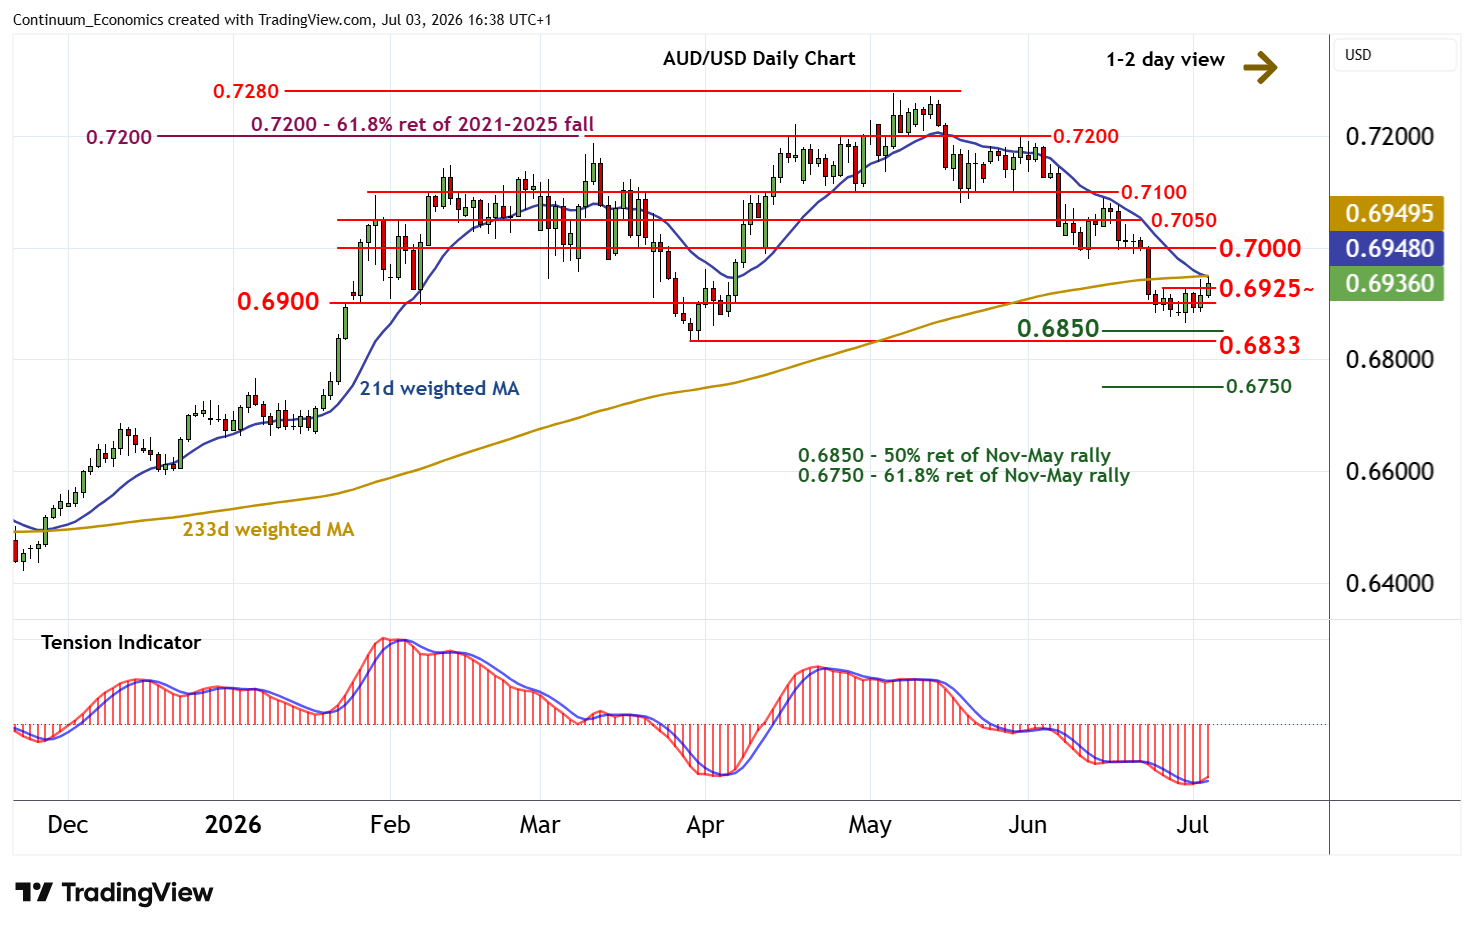
| Levels | Imp | Comment | Levels | Imp | Comment | |||
|---|---|---|---|---|---|---|---|---|
| R4 | 0.7100 | ** | congestion | S1 | 0.6900 | * | congestion | |
| R3 | 0.7050 | * | congestion | S2 | 0.6850 | ** | 50% ret of Nov-May rally | |
| R2 | 0.7000 | * | congestion | S3 | 0.6833 | ** | 30 Mar (m) low | |
| R1 | 0.6925 | 25 Jun high | S4 | 0.6750 | ** | 61.8% ret of Nov-May rally |
Asterisk denotes strength of level
16:05 BST - Consolidation above 0.6900 has given way to a test above the 0.6925 high of 25 June, with prices reaching 0.6950 before settling back towards 0.6925. Daily readings are rising and oversold weekly stochastics are flattening, highlighting room for fresh gains in the coming sessions. But the bearish weekly Tension Indicator and deteriorating longer-term charts should limit scope in renewed selling interest beneath congestion resistance at 0.7000. Following cautious/corrective trade, fresh losses are looked for. A break below 0.6900 will turn sentiment neutral. But a further close below the 0.6850 Fibonacci retracement and the 0.6833 monthly low of 30 March would turn sentiment negative and extend May losses towards 0.6750 retracement.