Published: 2026-08-19T00:59:37.000Z
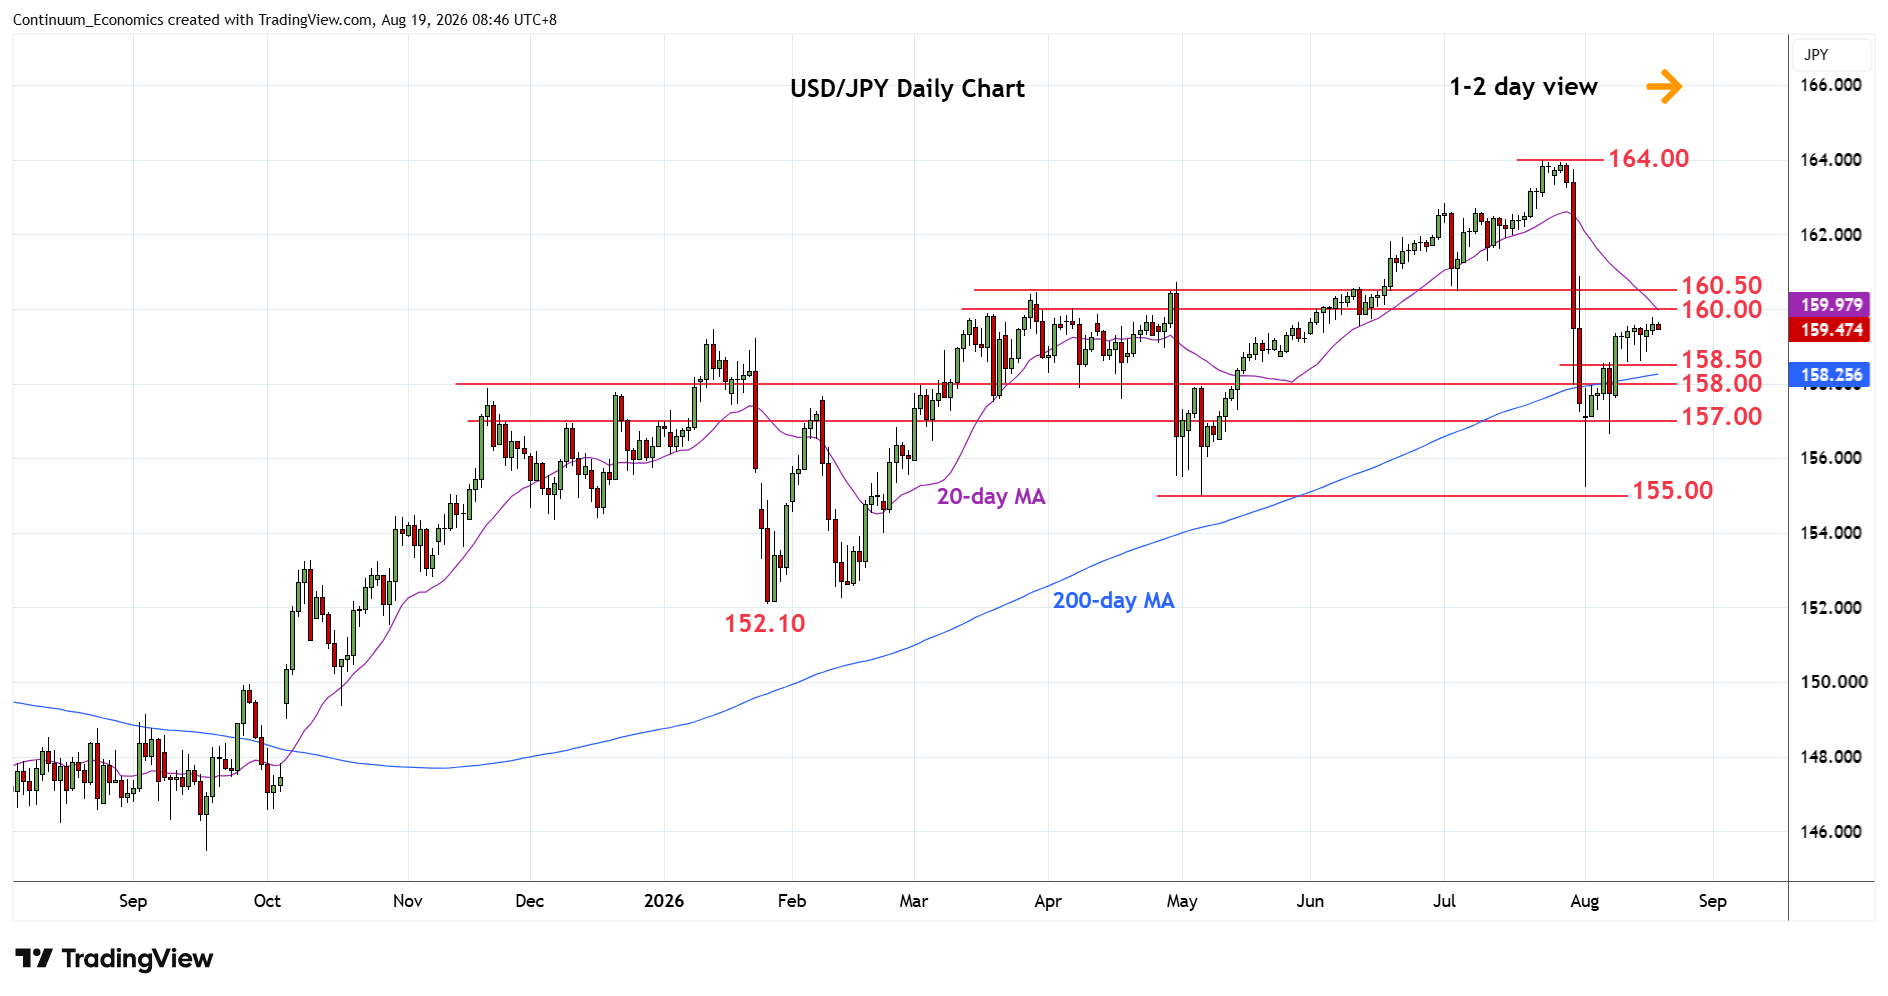
Chart USD/JPY Update: Consolidating at 159.78 high
3
Lower in range from the 159.78 high as prices unwind overbought intraday studies
| Levels | Imp | Comment | Levels | Imp | Comment | |||
|---|---|---|---|---|---|---|---|---|
| R4 | 161.00 | * | congestion | S1 | 158.50 | * | congestion | |
| R3 | 160.50 | ** | congestion, Mar high | S2 | 158.00 | * | congestion | |
| R2 | 160.00 | * | figure, congestion | S3 | 157.00 | * | congestion | |
| R1 | 159.78 | * | 18 Aug high | S4 | 156.65 | * | 7 Aug low |
Asterisk denotes strength of level
00:50 GMT - Lower in range from the 159.78 high as prices unwind overbought intraday studies. Daily chart are stretched as well and suggest scope for pullback to support at the 159.00/158.50 congestion area which should underpin. Break here will open up room for deeper pullback to retrace recent strong gains from the 155.22 low towards the 158.00 and 157.00 levels. Meanwhile, break above 159.78 high, if seen, will see room to extend bullish gains to the 160.00 figure and strong resistance at the 160.50 congestion and March high.