Published: 2026-11-03T00:53:41.000Z
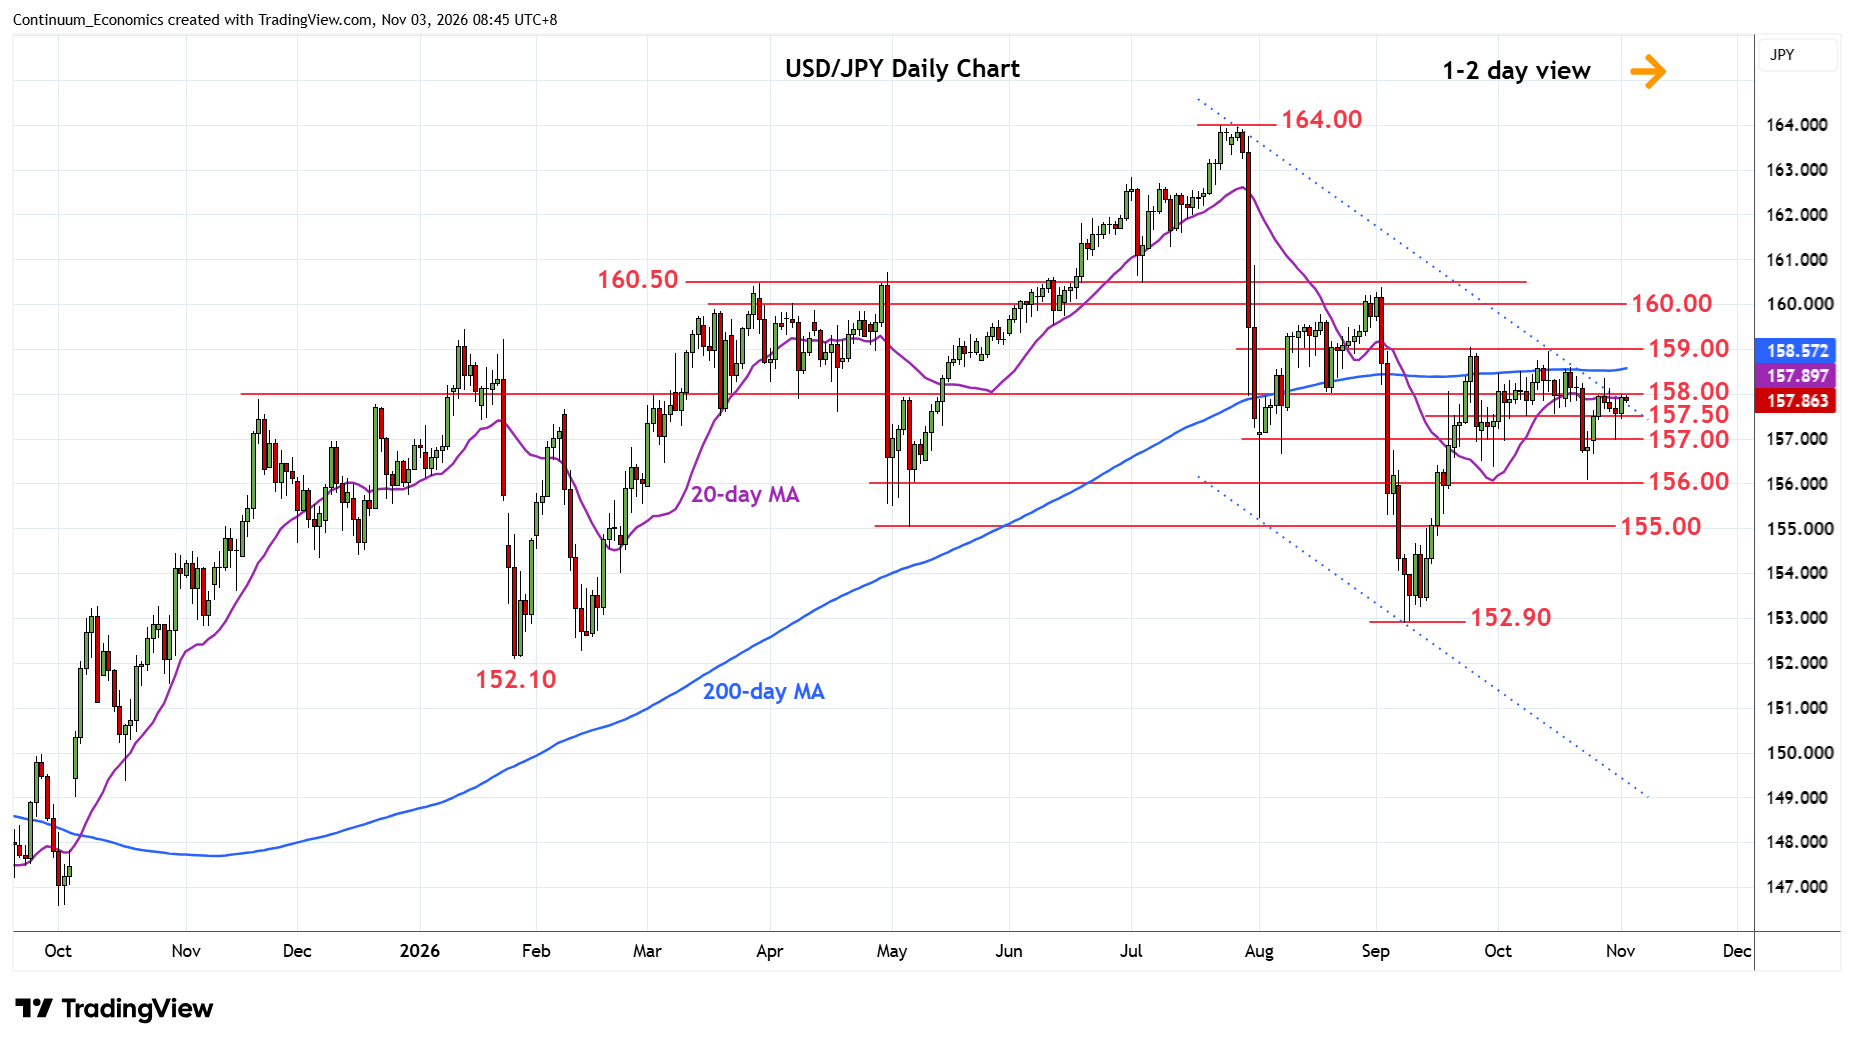
Chart USD/JPY Update: Back to pressure 158.00 resistance
1
Bounce from the 157.00 level see prices back to pressure resistance at the 158.00 congestion
| Levels | Imp | Comment | Levels | Imp | Comment | |||
|---|---|---|---|---|---|---|---|---|
| R4 | 160.00 | ** | figure, congestion | S1 | 157.50/00 | * | congestion | |
| R3 | 159.00 | ** | congestion, 24 Sep high | S2 | 156.50 | * | congestion | |
| R2 | 158.50 | * | congestion, 200-day MA | S3 | 156.07/00 | ** | 23 Oct low, congestion | |
| R1 | 158.00 | ** | figure, congestion | S4 | 155.00 | ** | May low, congestion |
Asterisk denotes strength of level
00:50 GMT - Bounce from the 157.00 level see prices back to pressure resistance at the 158.00 congestion but mixed daily studies suggest ranging action likely to extend. Break here, will see room for extension to retest resistance at the 158.35/50 congestion area. Clearance here will see room for retest of the 159.00 high of 24 September high which is expected to cap. Meanwhile, support remains at the 157.50/157.00 congestion. A later break here will return focus to the downside for retest of the 156.07/00 congestion. Below here will open up strong support at the 155.00 May low to retest.