Published: 2026-09-15T01:59:45.000Z
Chart GBP/USD Update: Under pressure
2
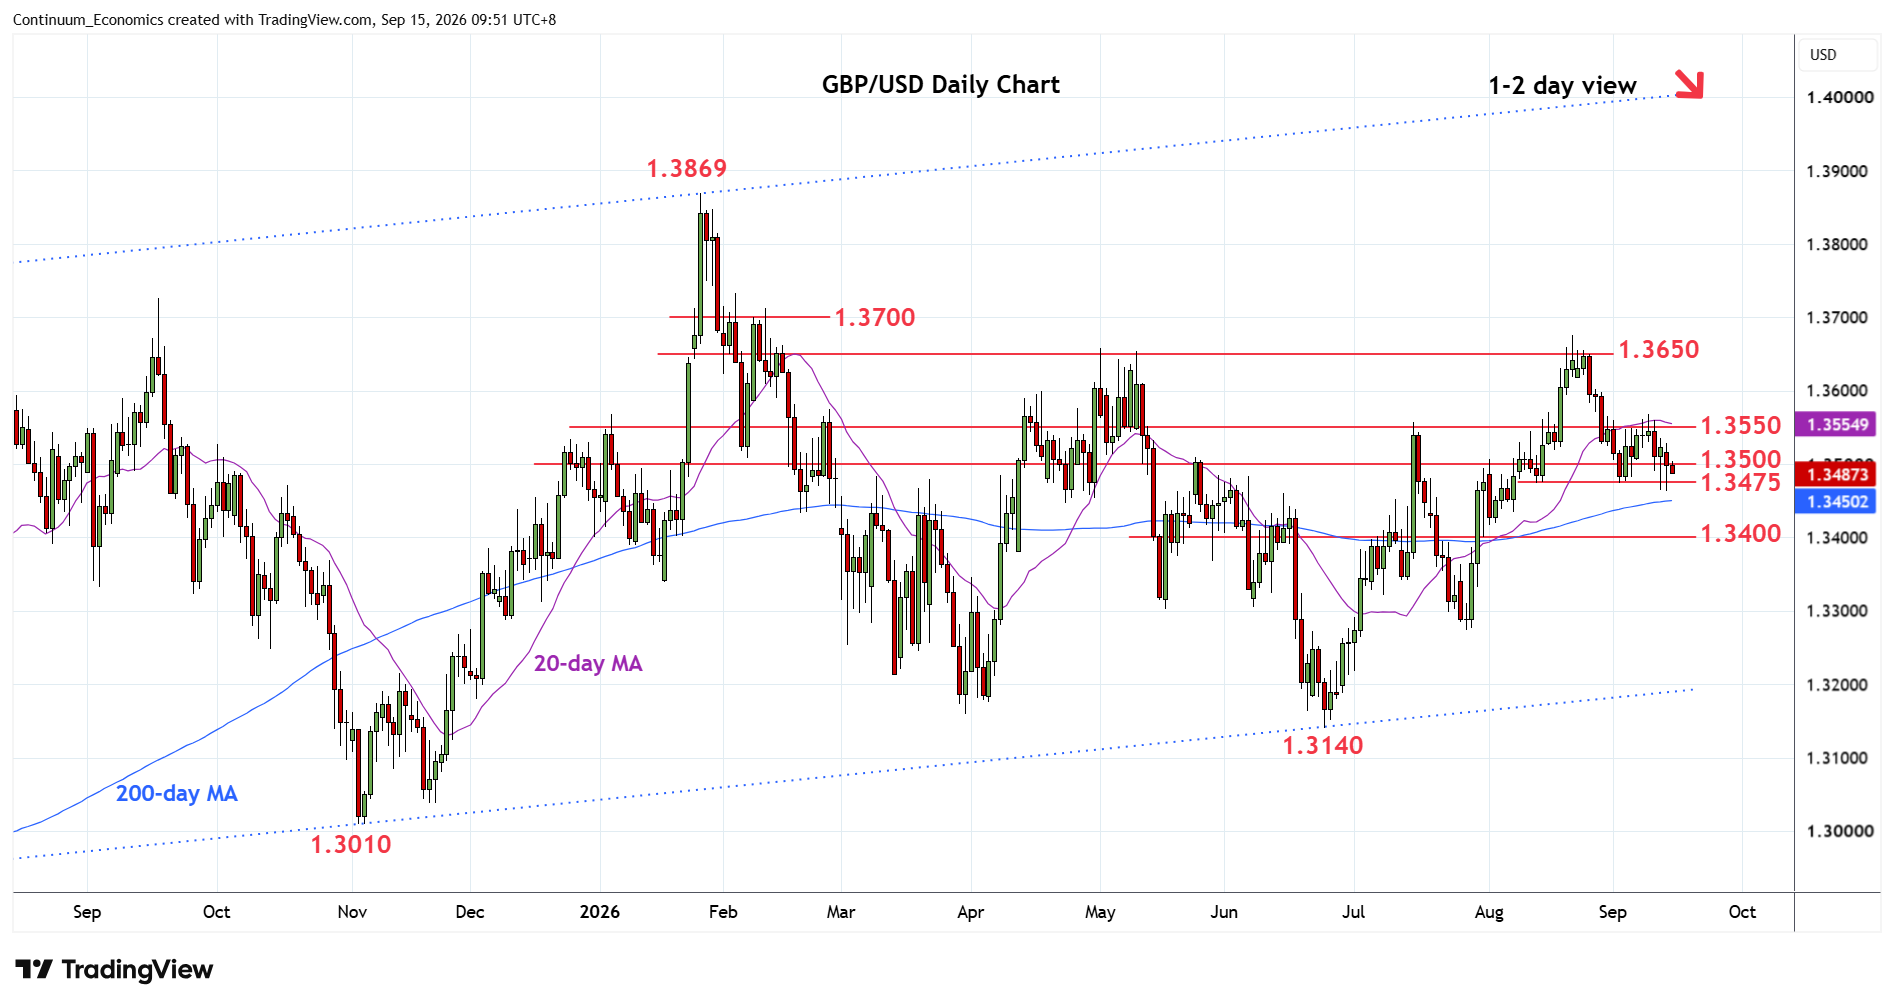
Still limited below the 1.3475 support but pressure remains on the downside following rejection from the 1.3568 high of last week
| Level | Comment | Level | Comment | |||||
|---|---|---|---|---|---|---|---|---|
| R4 | 1.3700 | * | congestion | S1 | 1.3475 | ** | 13 Aug low | |
| R3 | 1.3650/75 | ** | congestion, Aug high | S2 | 1.3450 | * | congestion | |
| R2 | 1.3600 | * | congestion | S3 | 1.3405/00 | * | 50% Jun/Aug rally, congestion | |
| R1 | 1.3550 | * | congestion | S4 | 1.3350 | * | congestion |
Asterisk denotes strength of level
01:50 GMT - Still limited below the 1.3475 support but pressure remains on the downside following rejection from the 1.3568 high of last week. Negative daily and weekly studies suggest scope for deeper pullback to retrace the June/August gains. Lower will see room to 1.3450 congestion then the 1.3405, 50% Fibonacci level. Meanwhile, resistance at the 1.3550/68 congestion and high of last week is expected to cap. Would take break here to revive upside focus and see room to the 1.3600 level then the 1.3650/75, May/August highs.