Published: 2026-07-21T12:06:16.000Z
Chart USD/RUB Update: Balanced at the 78.4600 Fibonacci retracement - studies improving
2
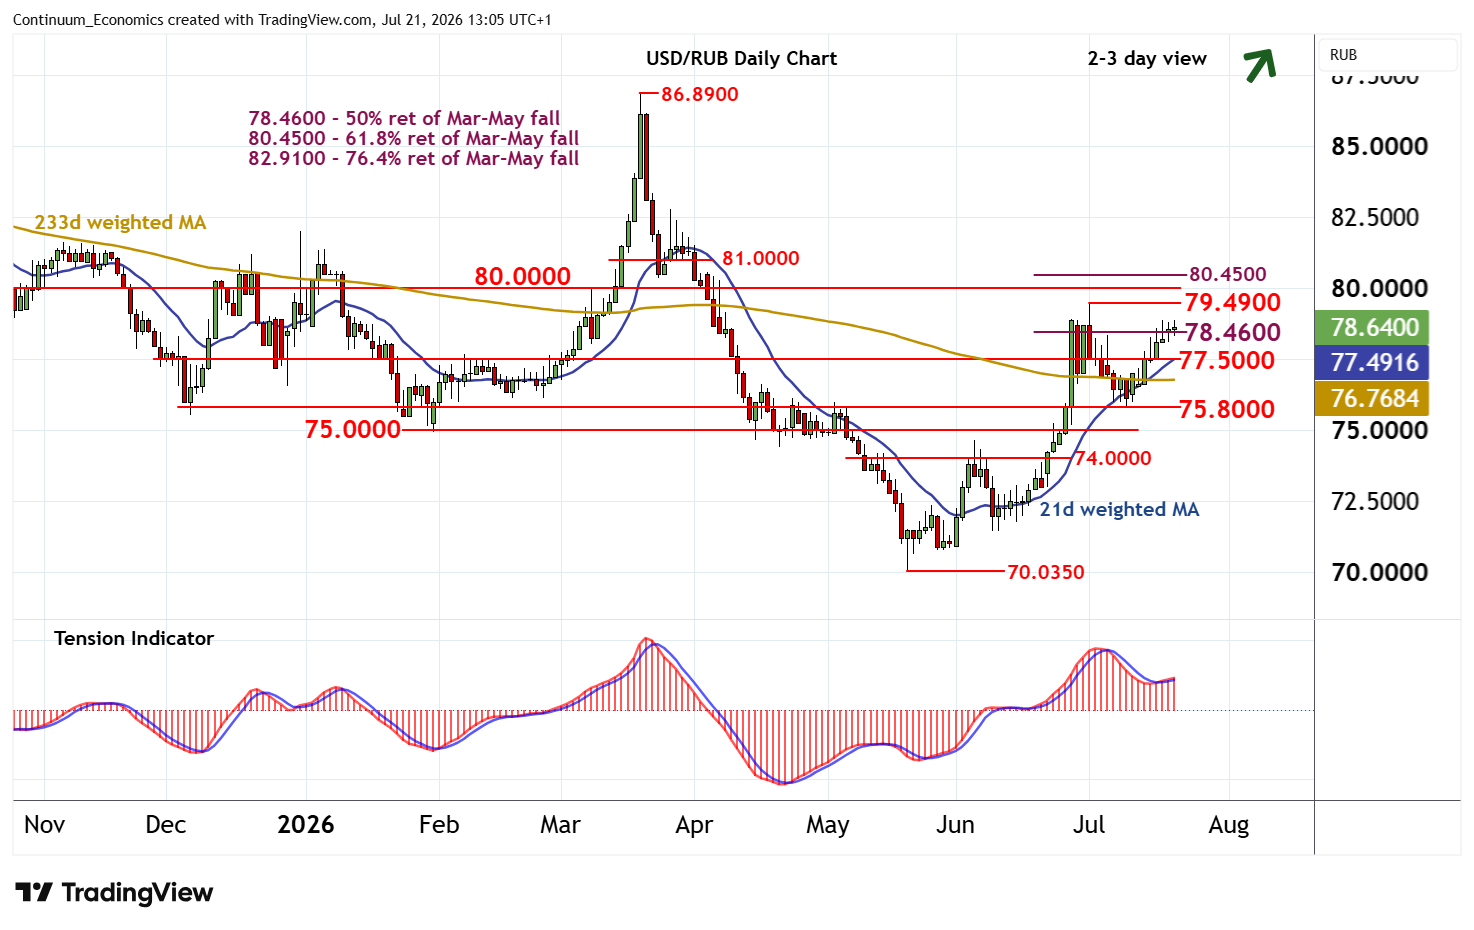
Steady buying interest has reached resistance at the 78.4600 Fibonacci retracement
| Levels | Comment | Levels | Comment | |||||
| R4 | 80.4600 | ** | 61.8% ret of Mar-May fall | S1 | 77.5000 | ** | congestion | |
| R3 | 80.0000 | ** | break level | S2 | 75.8000 | * | congestion tops | |
| R2 | 79.4900 | * | 1 Jul (w) high | S3 | 75.0000 | ** | congestion | |
| R1 | 78.4600 | ** | 50% ret of Mar-May fall | S4 | 74.0000 | * | congestion |
Asterisk denotes strength of level
12:40 BST - Steady buying interest has reached resistance at the 78.4600 Fibonacci retracement, where fresh consolidation is developing. Daily readings are rising and broader weekly charts are positive, highlighting room for continuation towards the 79.4900 weekly high of 1 July. A close above here would improve sentiment and confirm continuation of May gains, initially towards resistance at the 80.0000 break level and the 80.4600 Fibonacci retracement. Meanwhile, support is at congestion around 77.5000. A close beneath here, if seen, would turn sentiment neutral and give way to consolidation above 75.8000.