Chart EUR/JPY Update: Balanced above strong support - background studies under pressure
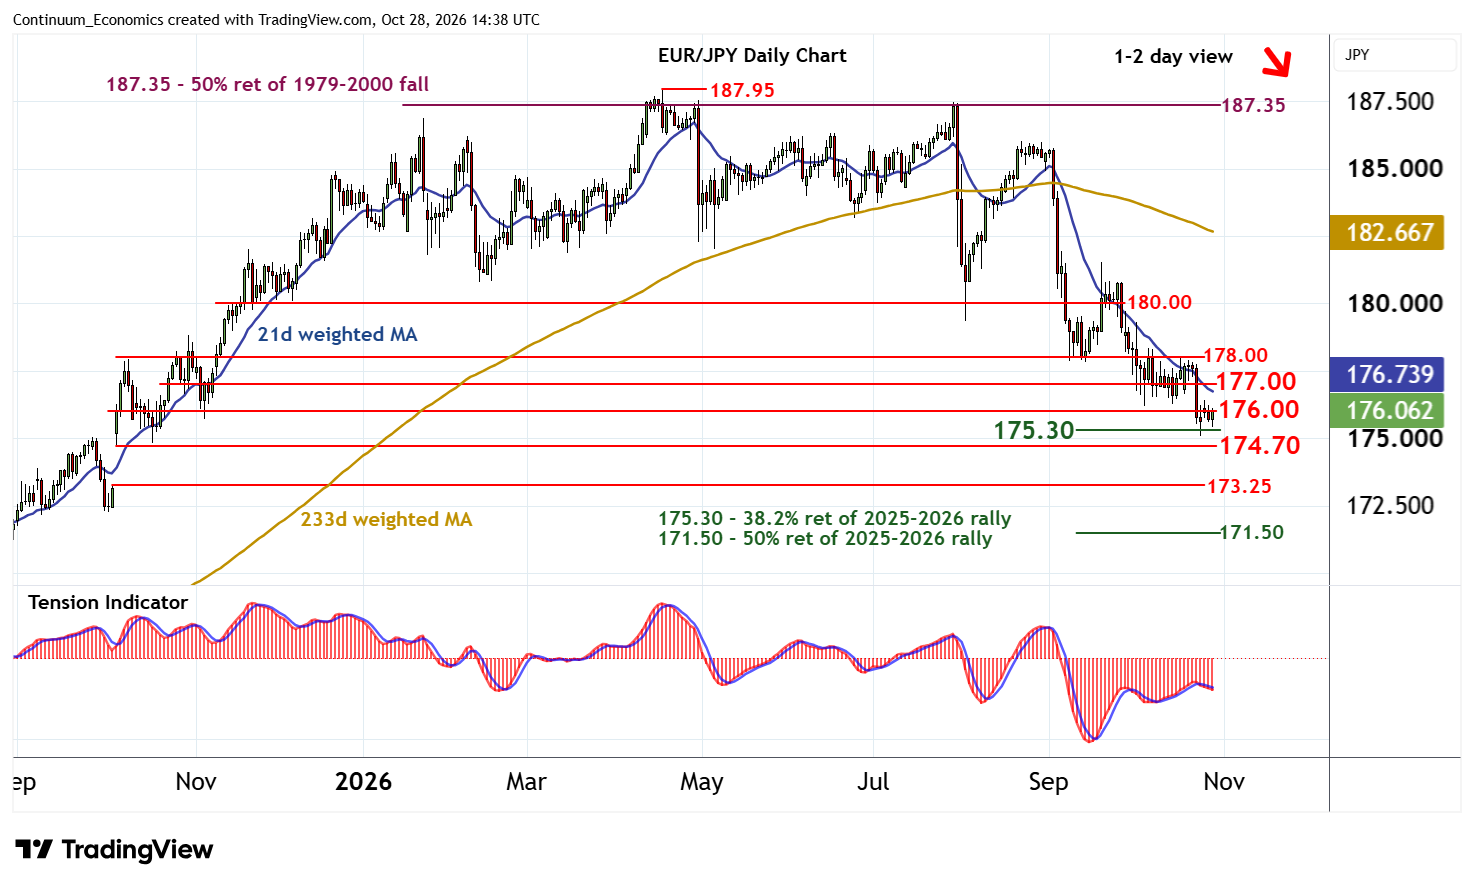
The anticipated break below 176.00 has bounced from just above support at the 175.30 Fibonacci retracement
| Levels | Imp | Comment | Levels | Imp | Comment | |||
|---|---|---|---|---|---|---|---|---|
| R4 | 179.00 | * | congestion | S1 | 175.30 | ** | 38.2% ret of 2025-2026 rally | |
| R3 | 178.00 | * | congestion | S2 | 175.00/10~ | * | congestion; 23 Oct YTD low | |
| R2 | 177.00 | * | congestion | S3 | 174.70 | ** | 6 Oct 25 low, gap high | |
| R1 | 176.00 | ** | congestion | S4 | 173.25 | ** | 5 Oct 25 high, gap low |
Asterisk denotes strength of level
14:25 GMT - The anticipated break below 176.00 has bounced from just above support at the 175.30 Fibonacci retracement, with prices currently pressuring 176.00. Rising intraday studies and a tick higher in oversold daily stochastics suggest room for a test back above here. But the bearish daily Tension Indicator and mixed/negative weekly charts should limit scope in renewed selling interest towards further congestion around 177.00.
Following cautious/corrective trade, fresh losses are looked for. A later break below 175.30 will open up the 175.10 current year low of 23 October. Continuation beneath here will add weight to sentiment and extend April losses initially towards the 174.70 gap high from 6 October.