Weekly Chart USD Index DXY: Range extension - background studies rising
The anticipated break below 101.50 has tested below further support at the 101.30 Fibonacci retracement
The anticipated break below 101.50 has tested below further support at the 101.30 Fibonacci retracement,
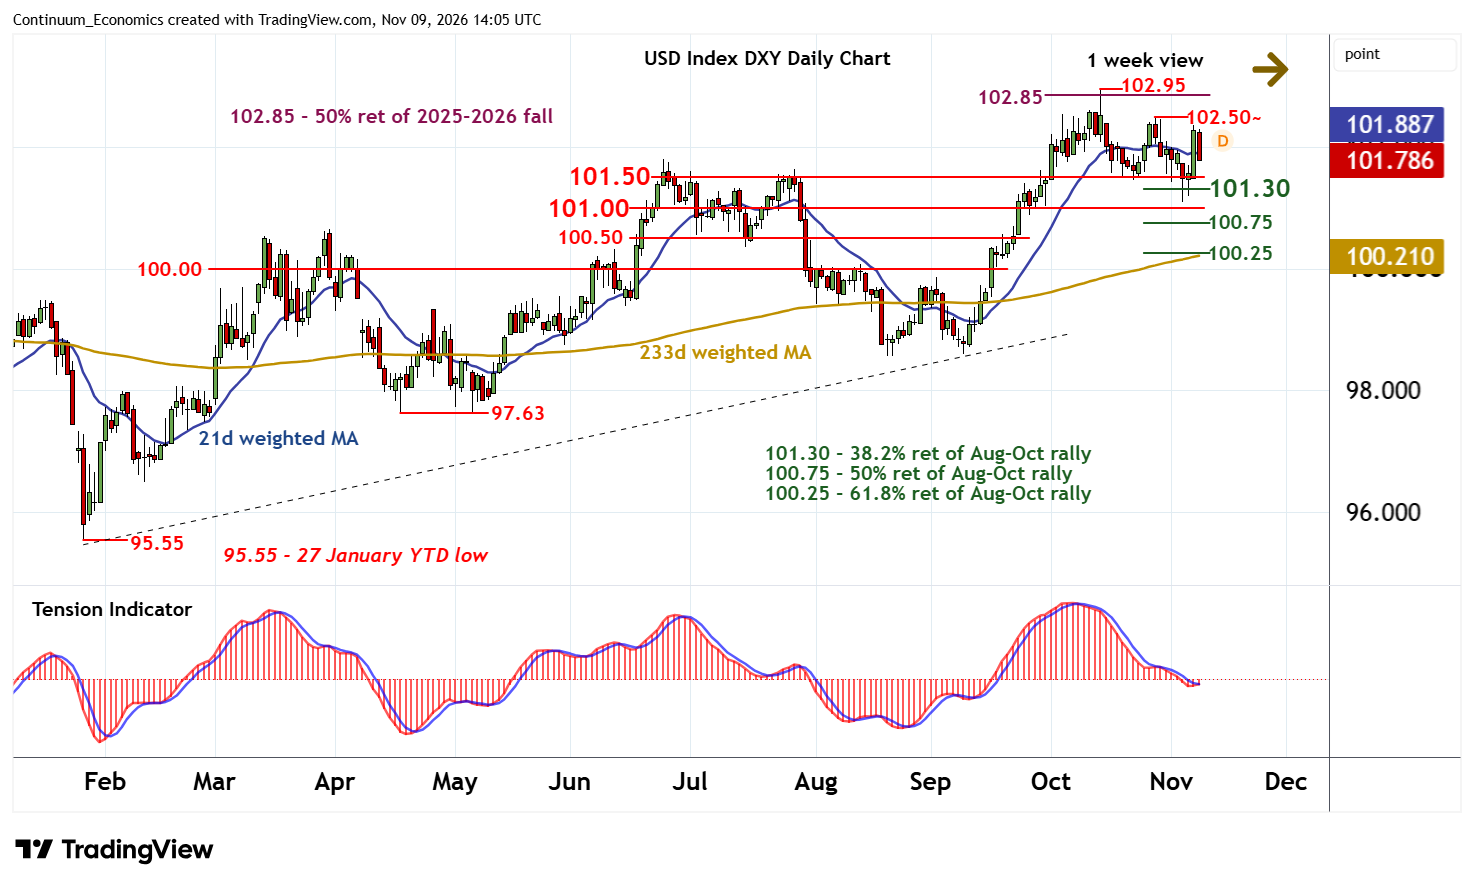
with prices bouncing from just above 101.00 into range extension around 102.00.
A tick higher in oversold daily stochastics and the flat daily Tension Indicator highlight room for cautious trade in the coming sessions. However, recent volatility is heightened, suggesting potential for a fresh spike lower. A close below 101.30, if seen, would add weight to sentiment and extend losses from the 102.95 current year high of 14 October towards congestion around 101.00. However, daily stochastics are also close to oversold areas, suggesting any deeper tests beneath here could give way to short-covering/consolidation above the 100.75 retracement.
Meanwhile, resistance remains at 102.00 and extends to the 102.50 high of 28 October.
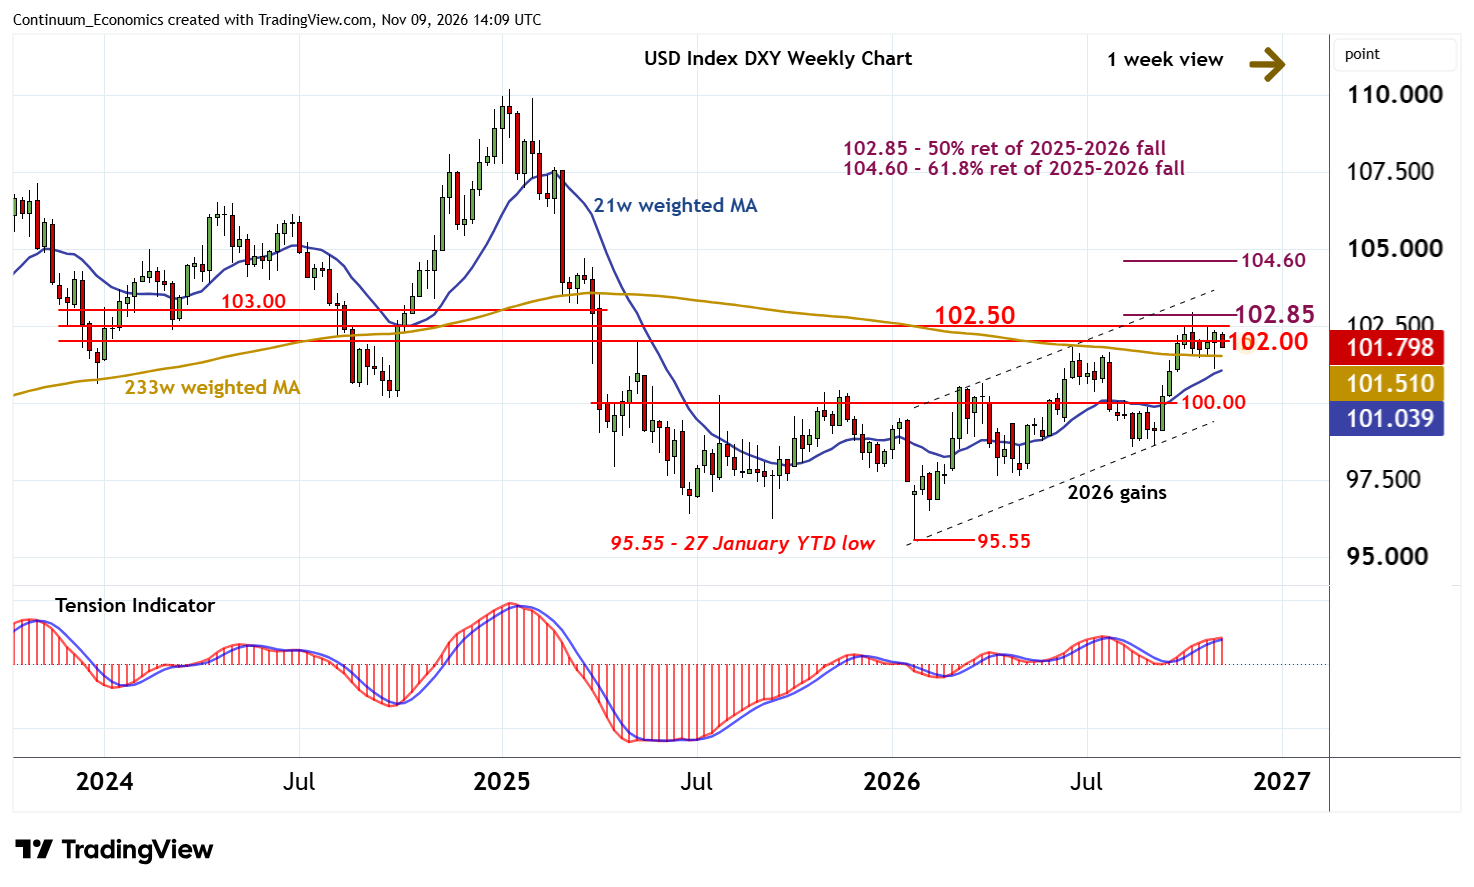
A tick lower in overbought weekly stochastics and the flat weekly Tension Indicator highlight consolidation beneath here. Rising longer-term charts point to later gains. But a close above 102.85 multi-month retracement is needed to turn sentiment positive and confirm continuation of January gains beyond congestion around 103.00. Longer-term focus will then turn to the 104.60 retracement.