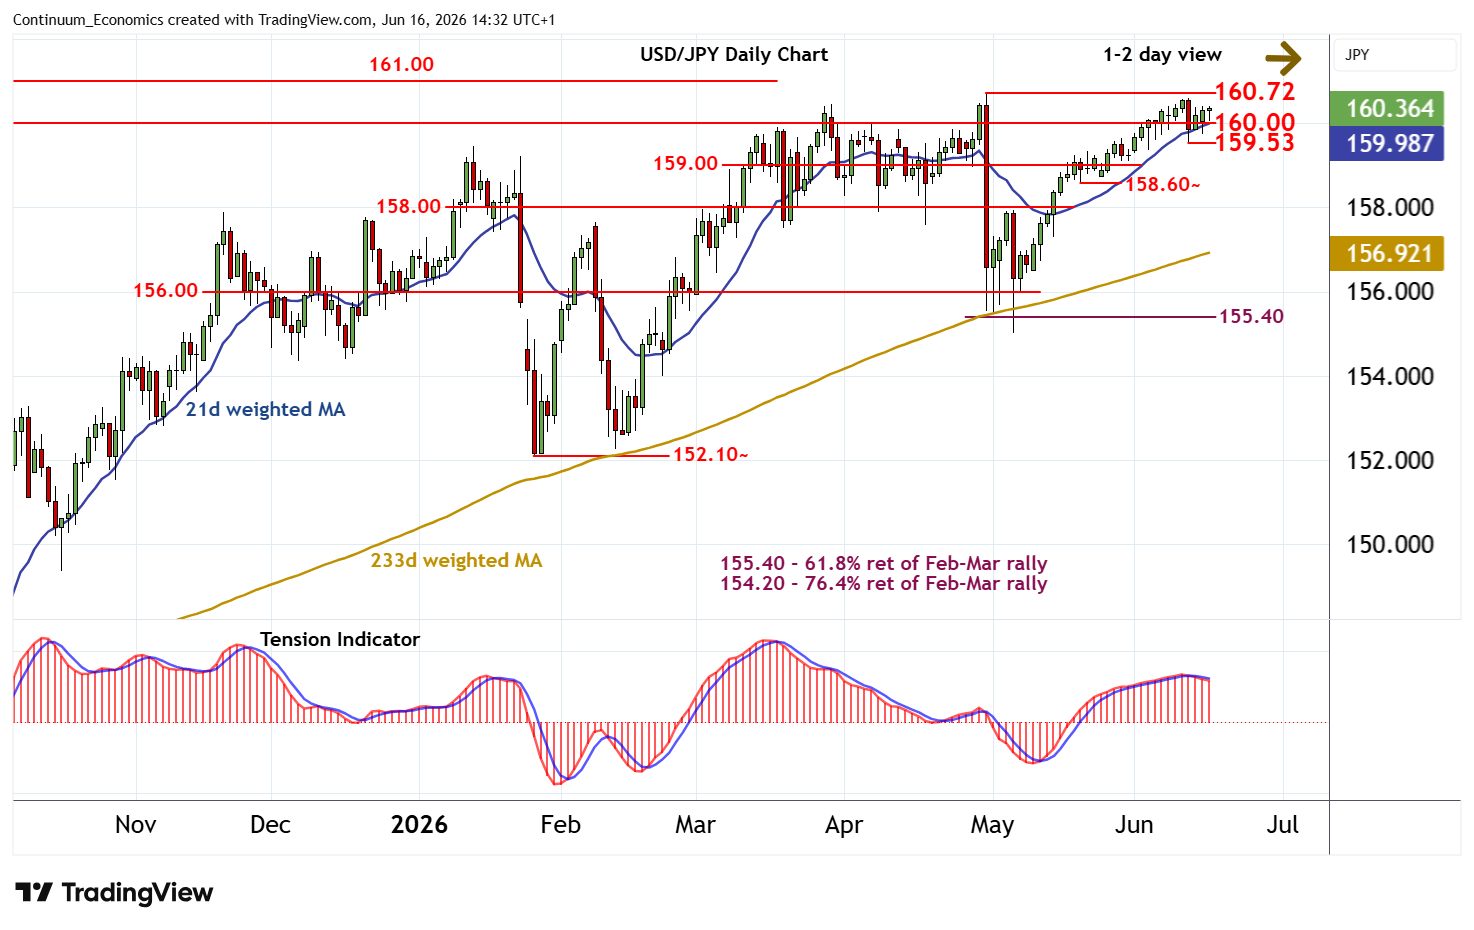
Chart USD/JPY Update: Edging higher in range
Still little change, as prices extend consolidation above congestion support at 160.00
| Levels | Imp | Comment | Levels | Imp | Comment | |||
|---|---|---|---|---|---|---|---|---|
| R4 | 161.95 | ** | July 2024 multi-year high | S1 | 160.00 | ** | congestion | |
| R3 | 161.00 | ** | Jun-Jul 2024 congestion | S2 | 159.50~ | 11 Jun low | ||
| R2 | 160.72 | ** | 30 Apr YTD high | S3 | 159.00 | * | congestion | |
| R1 | 160.60 | * | 11 Jun (w) high | S4 | 158.60~ | * | 20 May (w) low |
Asterisk denotes strength of level
13:55 BST - Still little change, as prices extend consolidation above congestion support at 160.00. Intraday studies are rising and negative daily stochastics are flattening, suggesting potential for drift higher towards resistance at the 160.60 weekly high of 11 June. Just higher is the 160.72 current year high of 30 April. But the bearish daily Tension Indicator is expected to limit any initial tests of this range in renewed consolidation, before rising weekly charts prompt further gains. A close above here would improve price action and extend September 2024 gains towards critical multi-year resistance at the 161.95 year high of July 2024. Meanwhile, any tests below 160.00 should be limited in renewed buying interest above 150.50~.