Published: 2026-09-24T01:59:20.000Z
Chart GBP/USD Update: Room to extend losses
2
Sharply lower through the 1.3300/1.3273 support to reach 1.3223 low
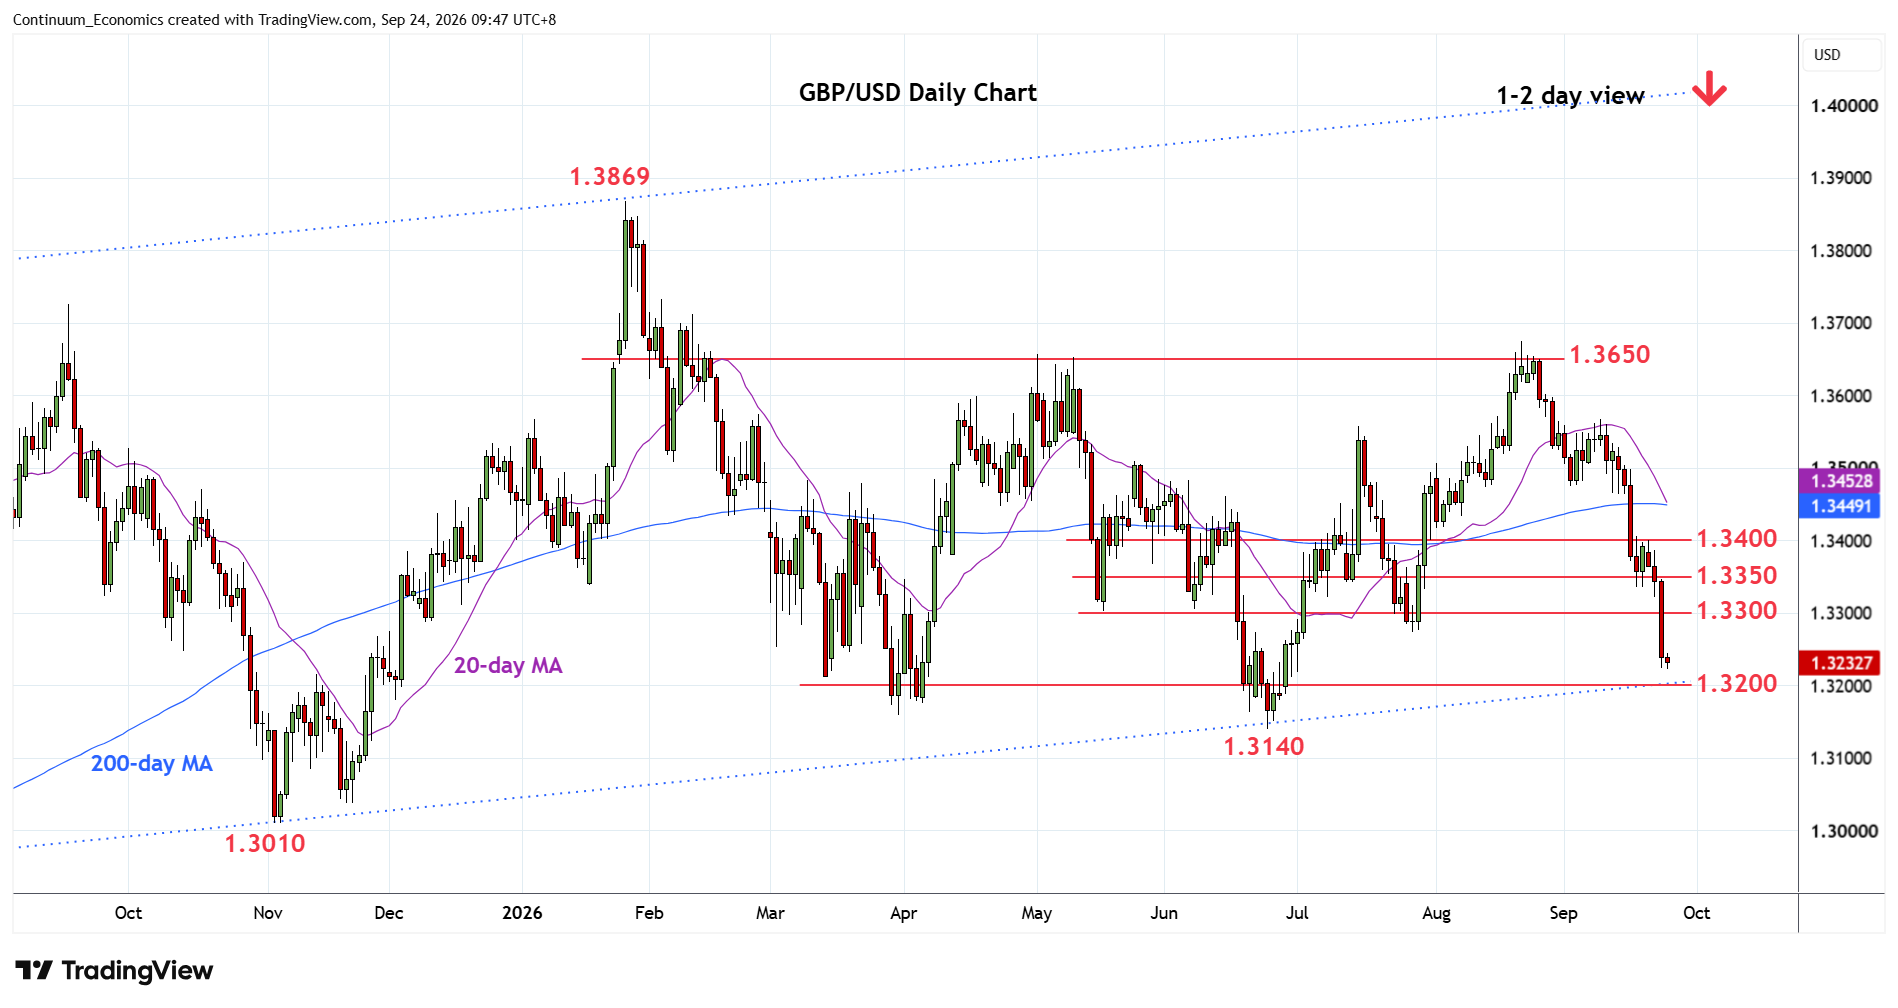
| Level | Comment | Level | Comment | |||||
|---|---|---|---|---|---|---|---|---|
| R4 | 1.3450 | * | congestion | S1 | 1.3200 | * | congestion, channel | |
| R3 | 1.3400 | ** | congestion | S2 | 1.3140 | ** | 24 Jun YTD low | |
| R2 | 1.3350 | * | congestion | S3 | 1.3100 | * | congestion | |
| R1 | 1.3273/00 | * | 28 Jul low, congestion | S4 | 1.3010 | ** | Nov 2025 low |
Asterisk denotes strength of level
01:50 GMT - Sharply lower through the 1.3300/1.3273 support to reach 1.3223 low. Consolidation here see prices unwinding oversold intraday studies but focus remains on the downside and see room to extend losses from the 1.3675, August high. Bearish momentum suggest scope for break of 1.3200 level and channel support to expose the 1.3160 and 1.3140 March/June lows to retest and where reaction can be expected. Meanwhile, resistance is lowered to 1.3273/1.3300 area. Regaining these will ease the downside pressure and see room for stronger bounce to the 1.3350/1.3400 congestion area.