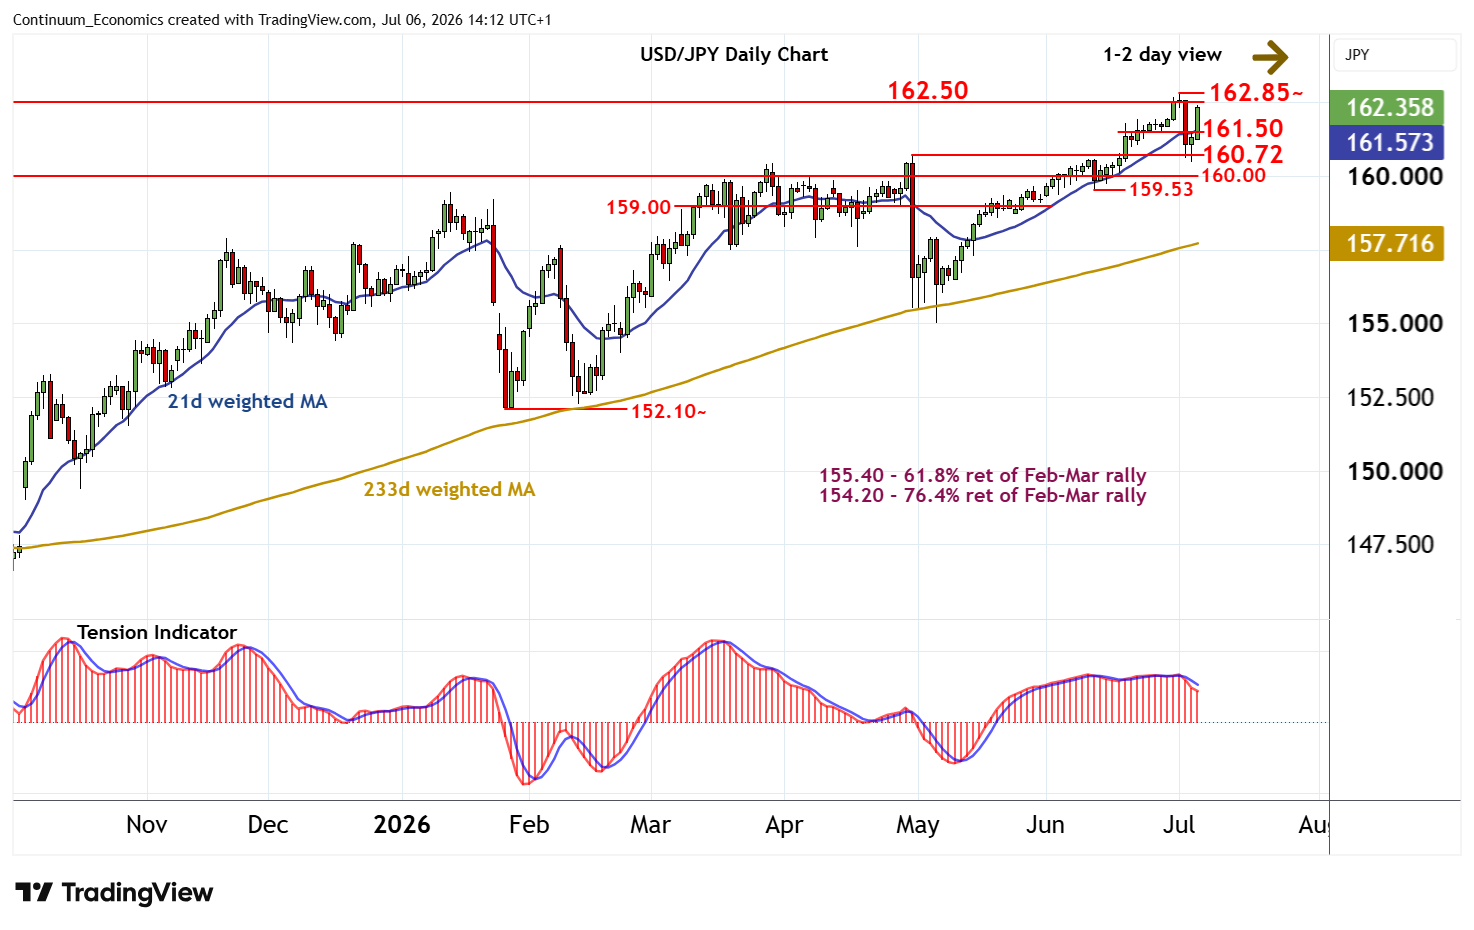
Chart USD/JPY Update: Smart bounce in both USD- and JPY-driven trade
Consolidation has given way to a sharp run higher in both USD- and JPY-driven trade
| Levels | Imp | Comment | Levels | Imp | Comment | |||
|---|---|---|---|---|---|---|---|---|
| R4 | 163.95 | ** | December 1986 high | S1 | 161.50 | * | intraday break level | |
| R3 | 163.00 | * | historic congestion | S2 | 161.00 | * | intraday lows | |
| R2 | 162.85~ | ** | 1 July multi-year high | S3 | 160.72 | * | 30 Apr (m) high | |
| R1 | 162.50 | historic congestion | S4 | 160.00 | ** | congestion |
Asterisk denotes strength of level
13:50 BST - Consolidation has given way to a sharp run higher in both USD- and JPY-driven trade, with prices currently balanced around 162.35. Immediate focus is on resistance within the 162.50 - 162.85~ range. But negative daily readings and flattening overbought weekly stochastics should limit any initial tests in consolidation. The weekly Tension Indicator continues to rise and longer-term charts are positive, highlighting room for later gains. But a close above the 162.85~ multi-year high of 1 July is needed to turn sentiment positive and extend long-term gains beyond 163.00 towards the 163.95 high of December 1986. Meanwihle, support is raised to 161.50. A close beneath here, if seen, would help to stabilise price action and prompt consolidation above the 160.72 monthly high of 30 April.