Published: 2026-07-23T13:20:59.000Z
Chart AUD/USD Update: Leaning lower in range
1
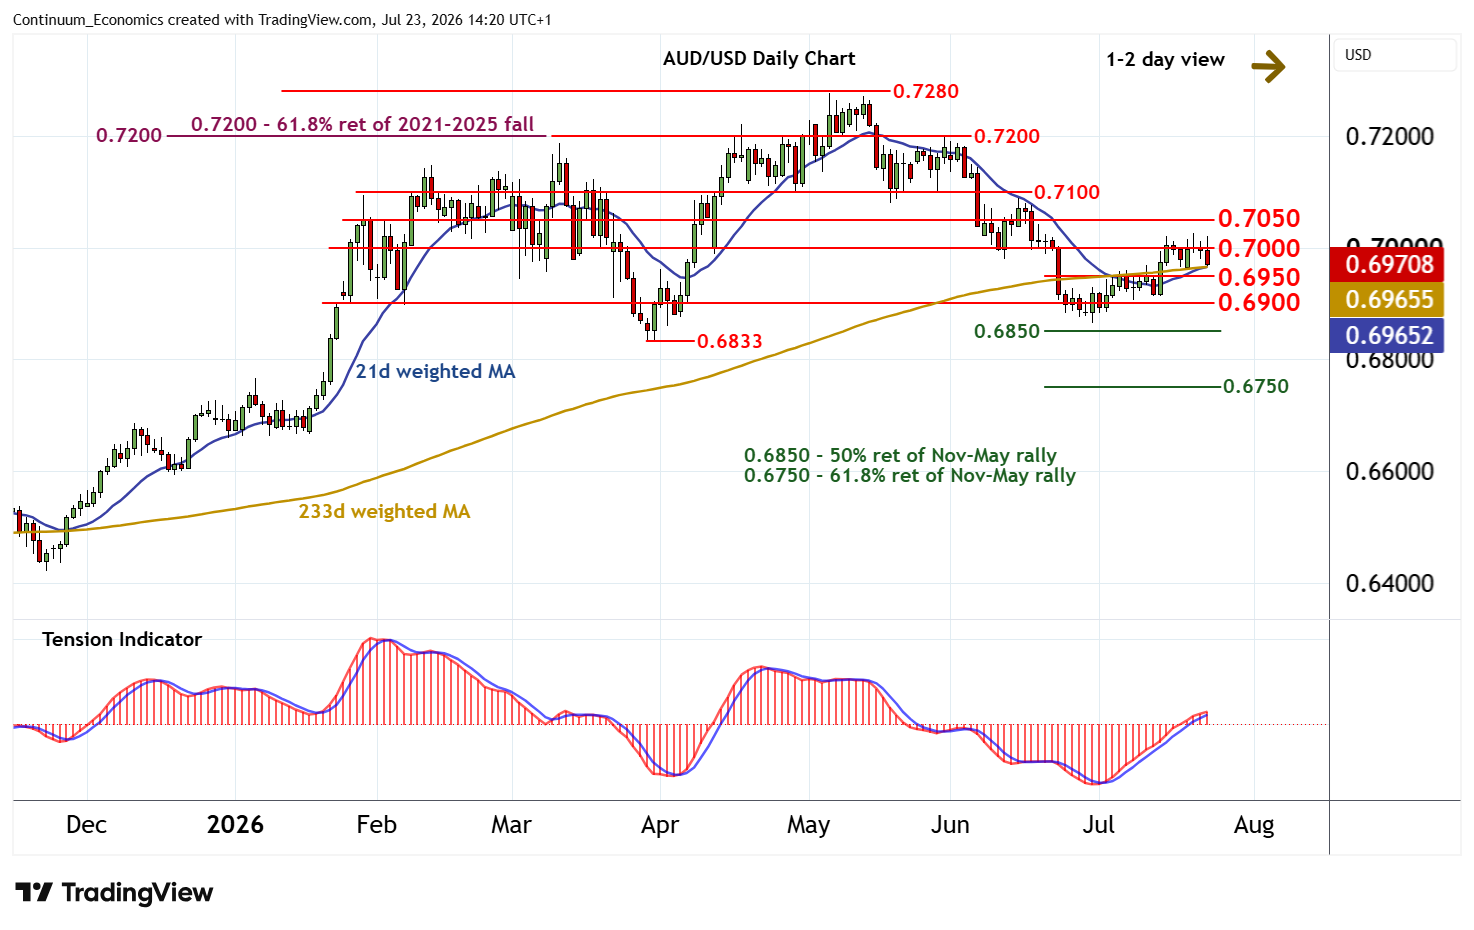
Choppy trade around congestion resistance at 0.7000 has given way to a pullback
| Levels | Imp | Comment | Levels | Imp | Comment | |||
|---|---|---|---|---|---|---|---|---|
| R4 | 0.7200 | ** | congestion | S1 | 0.6950 | congestion | ||
| R3 | 0.7100 | ** | congestion | S2 | 0.6900 | * | congestion | |
| R2 | 0.7050 | * | congestion | S3 | 0.6850 | ** | 50% ret of Nov-May rally | |
| R1 | 0.7000 | * | congestion | S4 | 0.6833 | ** | 30 Mar (m) low |
Asterisk denotes strength of level
14:15 BST - Choppy trade around congestion resistance at 0.7000 has given way to a pullback, as intraday studies turn down, with immediate focus on congestion support at 0.6950. Overbought daily stochastics are unwinding and the positive daily Tension Indicator is flattening, suggesting room for further losses in the coming sessions. A break beneath here will open up congestion around 0.6900. But mixed weekly charts should limit any initial tests in consolidation. Meanwhile, a close above 0.7000 would provide further stability for prices and prompt consolidation beneath 0.7050.