Published: 2026-06-25T13:11:04.000Z
Chart USD/JPY Update: Consolidating test of critical resistance
1
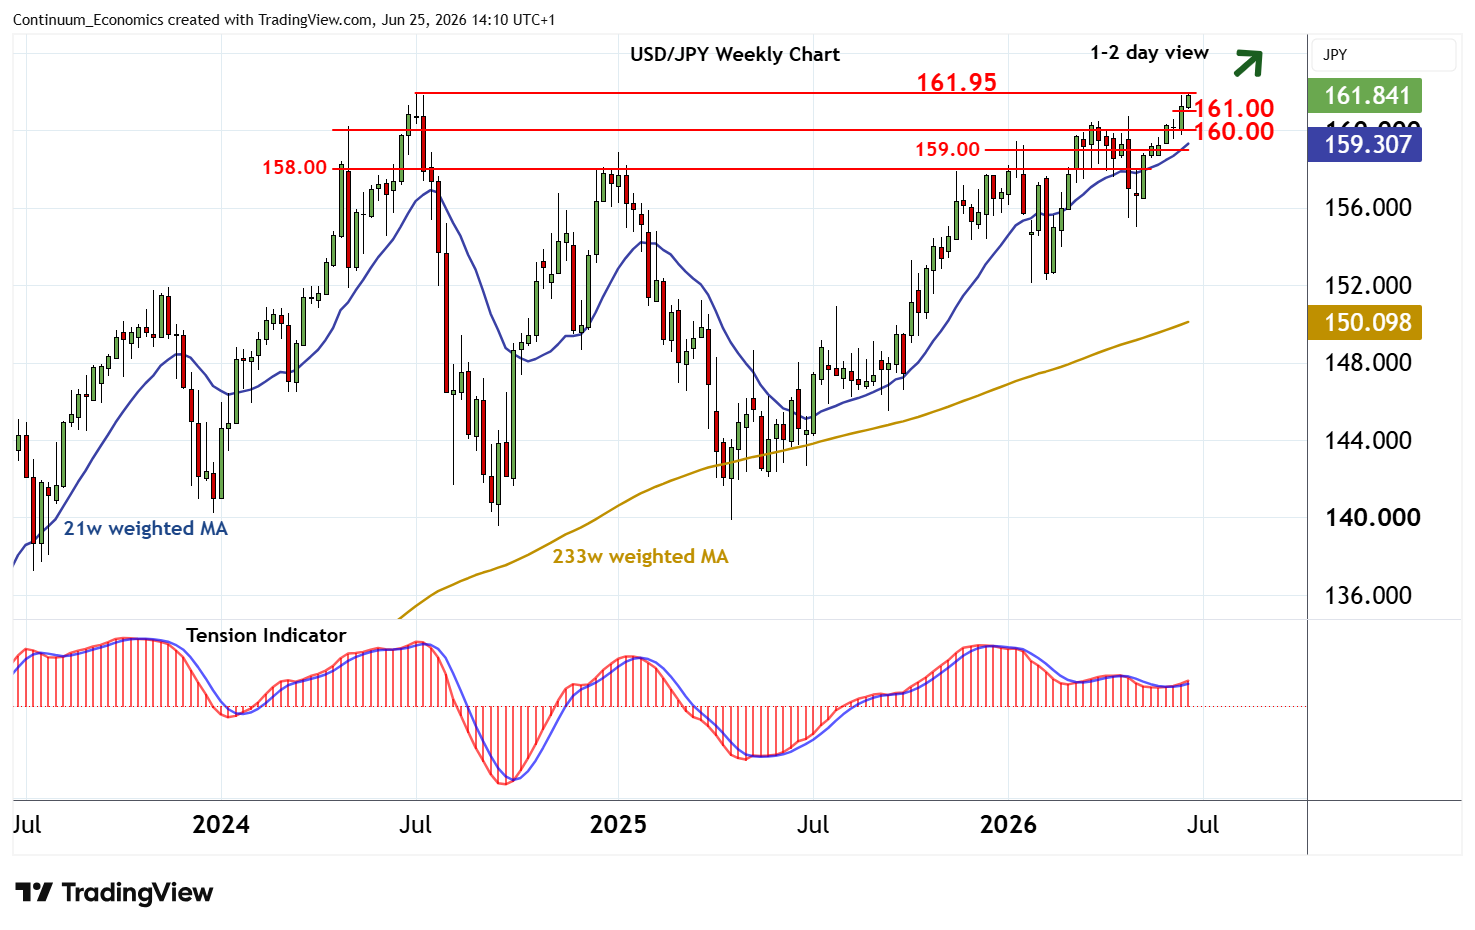
Little change, as prices extend cautious trade following the test of critical resistance at the 161.95 multi-year high of July 2024
| Levels | Imp | Comment | Levels | Imp | Comment | |||
|---|---|---|---|---|---|---|---|---|
| R4 | 165.00 | * | historic congestion | S1 | 161.50 | intraday break level | ||
| R3 | 163.95 | * | December 1986 high | S2 | 161.00 | * | intraday lows | |
| R2 | 163.00 | * | historic congestion | S3 | 160.00 | ** | congestion | |
| R1 | 161.95 | ** | July 2024 multi-year high | S4 | 159.50~ | * | 11 Jun (w) low |
Asterisk denotes strength of level
13:55 BST - Little change, as prices extend cautious trade following the test of critical resistance at the 161.95 multi-year high of July 2024. Daily readings are mixed/positive and broader weekly charts are rising, highlighting room for further strength in the coming sessions. However, a close above here is needed confirm continuation of long-term bull trends, initially towards historic congestion around 163.00. Meanwhile, support remains at 161.50. But a close below 161.00, if seen, would turn sentiment neutral and prompt fresh consolidation above 160.00.